Objects are any element that you can add in PowerPoint 2019. A text label is an object. An image is an object. Graphs and charts are objects. Any element within a slideshow is an object. You must add these elements to your slideshow before you can see them, but Microsoft PowerPoint makes it easy to insert objects to display custom slides. Because PowerPoint is a Microsoft Office product, you can transfer images and objects easily by just copying and pasting them into your slides. PowerPoint also has a function to insert these objects, so you simply select an object from your computer's drive and insert it into your presentation.
The "Insert" Tab
The "Insert" tab is where you'll find any object that you want to add in PowerPoint. Since any addition to a slide is considered an object, you'll notice that there are numerous options in the "Insert" tab.
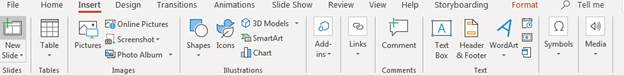
(Insert menu)
In the image above, there are several sections of objects that can be added to your presentations. The first section lets you insert objects that you've created in other Office programs. For instance, the "Tables" section lets you add tables that you've created in Microsoft Excel.
The next sections are objects related to images. You can add pictures that you stored on your local computer drive or ones that you find using Microsoft Bing search. You can also add shapes, which are not images found on your drive or the Internet, but instead they are drawings that you can use in presentation slides. For instance, you can draw a circle on your slide, and it's displayed as an object.
Miscellaneous text is also considered an object in PowerPoint 2019. Most people consider links as just another part of the text displayed in a presentation. However, links are also considered an object when working with PowerPoint presentations. We'll cover the basics of inserting a few of these objects, but the procedure to insert others is primarily the same steps.
Comments would be considered another miscellaneous object in PowerPoint. Comments are the bubble cloud sections of a PowerPoint slide that indicate another user has made a statement on the slide. Comments are often used during revisions when you have more than one person editing and writing a PowerPoint presentation. They are usually deleted after the final presentation is established, but they are still considered objects in Microsoft Office.
PowerPoint lets you add video to your slideshows, which can be found in the "Media" section of the menu. You can also add other types of objects. Text boxes, headers and footers, and WordArt are also types of objects that you can add to a presentation. Text boxes are standard labels in a PowerPoint presentation. They make up a majority of the objects added to a presentation, because they are the text and messages displayed to users on your slides.
Headers and footers are the content that can be seen in the upper and lower margins of a slide. Headers are useful if you have a page number or title for your slide since they display at the top of a slide. Footers display at the very bottom of a slide. Footers are beneficial if you have a copyright message or legal information that you must show on every slide regardless of its topic and content.
Inserting Objects into a Slide
Before you insert an object, you should know the type of the object that you want to add to a slide. The object can be anyone of the options in the "Insert' Tab. In this example, an image object is added, but you can use these instructions to add almost any object onto a slide.
When you open a PowerPoint presentation, the "Home" tab is the default one opened and displayed in the interface window. Click the "Insert" tab, and you will see all of the options available to insert objects. For this example, we will insert an image into a slide. If you have not already inserted a new slide into the presentation, right-click the left thumbnail panel and select "New Slide." A new slide is added and appended to the end of your current slides.
PowerPoint displays six icons in the center of the slide, which represent the objects that you can add. The main "Insert" tab has all available objects, but these six icons represent the majority of objects that you'll use in your presentations.
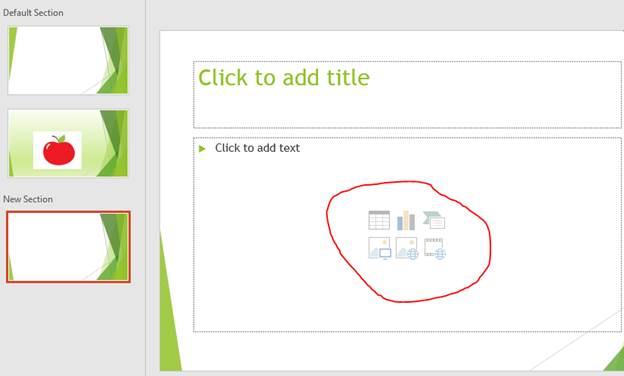
(Insertable objects in PowerPoint)
When you click the "Pictures" option in the main menu, a Windows dialog box opens asking you to choose a file from your local drive. This can be any image file stored on your computer. Double-click the image that you want to add to a slide, and it's auto-sized for the slide and displayed.
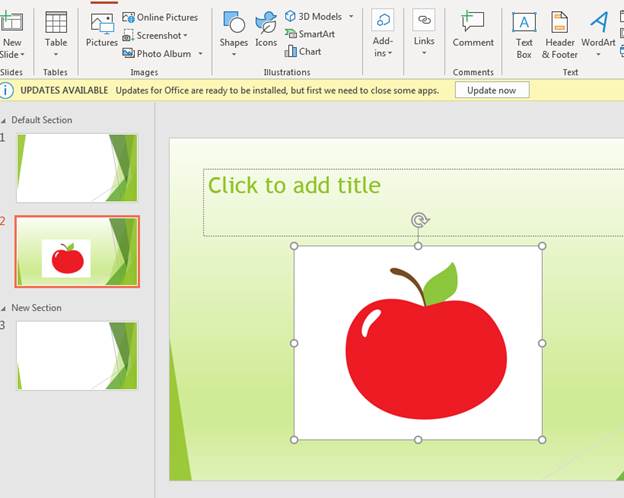
(Image added to a slide)
The circles surrounding the image are how you size the image. PowerPoint will auto-size it to what the program feels is a good fit for the slide, but you are free to expand or reduce the image's size.
PowerPoint has a table object where you can create a list of values similar to the way you work with Excel. PowerPoint tables don't have the features and enhancements available in Excel, but you can make a simple table by clicking the first icon in the object list. PowerPoint then asks you for the number of rows and columns.
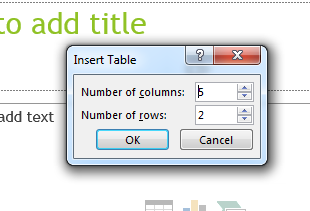
(Choose the number of rows and columns)
After you choose the number of rows and columns, click "OK" and a table is created in the selected slide.
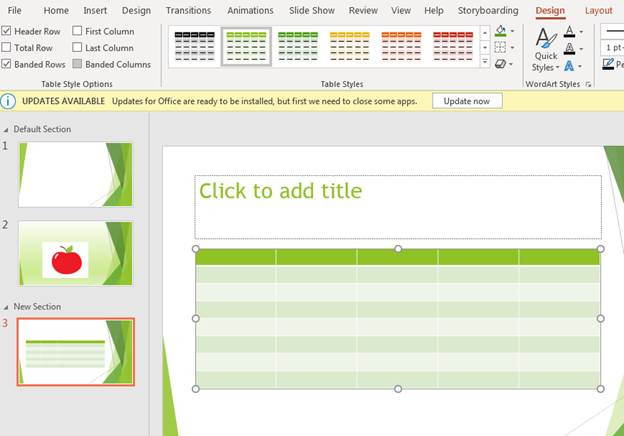
(Inserted table)
Notice that the table takes the same theme color as the rest of the slides. The "Insert" tab changes to a "Design" tab where you can see differently styles available for the table. When a table is selected, the main menu at the top of the window changes to styles and customizations for the object. This action will happen for every object that you insert and select in a slide.
Another common object inserted into PowerPoint presentations is charts. The chart object button is the second one listed on a new slide. Click it and PowerPoint 2019 displays a window where you select a chart type.
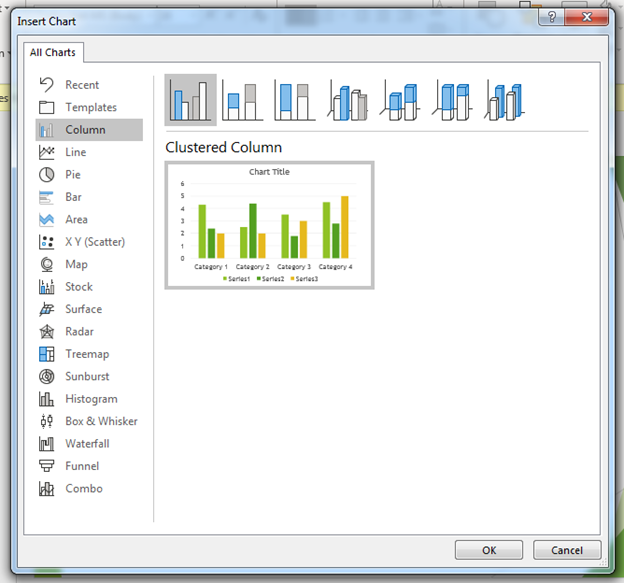
(Choose a chart)
PowerPoint supports numerous chart types along with various styles to display them. You still must fill in data and give the chart a title, but inserting a chart sets up a basic template for you to work with.
Select the chart type that you want and click "OK." A chart and temporary Excel window open.
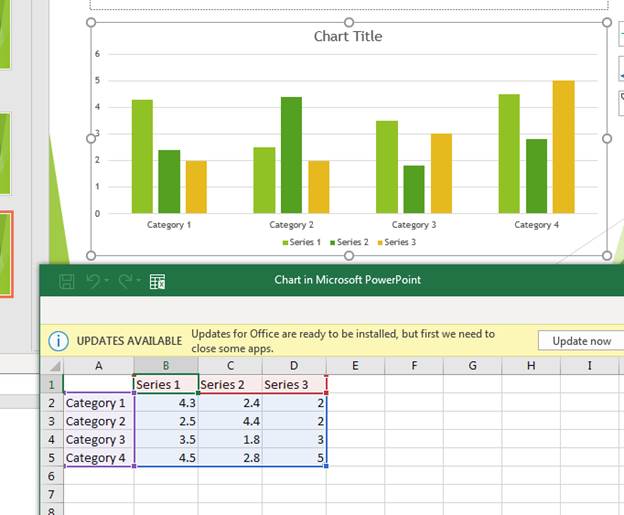
(Charting and Excel data)
Charts are based on columns and rows entered into a spreadsheet. Using a spreadsheet for data storage means that your charts will be dynamic. Should you change the data in the spreadsheet, it will reflect in the chart data shown in PowerPoint 2019.
We covered a few objects that you can insert into presentations, but you have several more. Use the main "Insert" tab to find the object that you want and with just a click of a button, the object is added to the presentation. Remember that since PowerPoint is a Microsoft Office product, most objects embedded in other Office applications can also be added to PowerPoint presentations.