
PowerPoint has its own small table ability similar Excel. It does not have all the in-depth features that you can use in Excel, but PowerPoint tables can be used to show small sets of data within a slide. As a matter of fact, PowerPoint uses Excel-like spreadsheet effects to make them intuitive components of your slideshows. Although Excel can display thousands of records in its interface, PowerPoint tables are usually small sections of data with only a few records that fit within one or two slides.
Inserting a Table
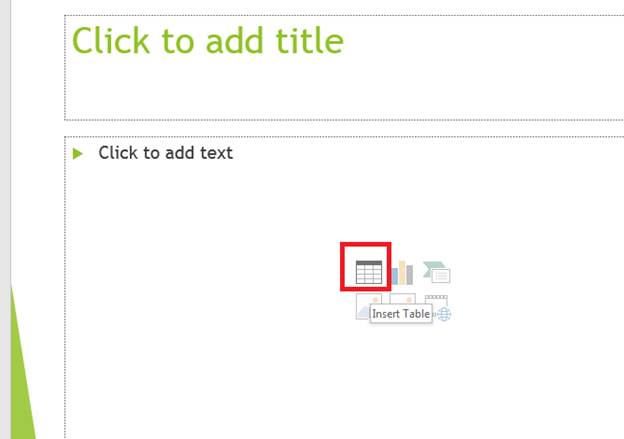
When you create a new slide, a standard template is used to lay out objects. One of the objects is a blank template where you choose what you want to add to the slide. There are six icon buttons shown in the black template area. The first one in the first row is the "Insert Table" icon button
(Insert Table button)
The "Insert Table" button is easy to identify, because it shows an image similar to an Excel spreadsheet. The icons tell you the object that you can insert. For instance, the icon to the right of the "Insert Table" icon button shows a graph. This image tells you that should you click the button, you will insert a graph into you slide. Since we want to insert a table, click the table icon and a new configuration window opens.
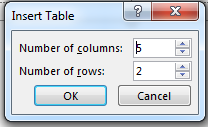
(Configure table settings)
Tables are made up of rows and columns. Rows represent the horizontal sections of the table. Rows contain data for one record. Columns are the fields that make up one item in a record. Tables can contain thousands of records, but PowerPoint 2019 isn't made for listing thousands of records. Should you need to list numerous records from a spreadsheet, it's more feasible to use Excel. Another option is to take only a few records and use them in your slideshows.
In the configuration window, you choose the number of rows and columns that you want. The default values are five columns and two rows. PowerPoint 2019 will auto-size the table to fit your slide but remember that too many rows or columns could make the slide difficult to read. After you click the "OK" button, the table is added to your slide.
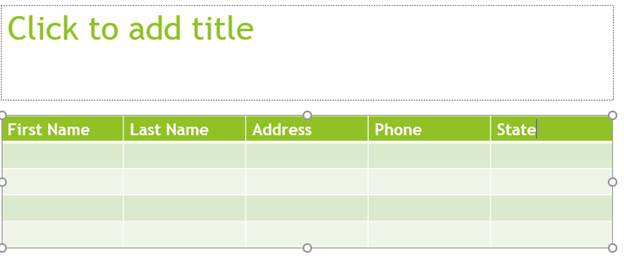
(Added table to a slide)
Notice that the table takes the same colors as the selected presentation theme. The first row is a slightly darker color to indicate that the first row is the header row. In spreadsheet software such as Excel, the first row is usually dedicated as the header cell. The header cell displays column names. These column names should specify the data that will show in each field.
In the image above, there are five columns. Each column has its own header. For instance, the first column has the header "First Name." The text has a white color, because it's the color for the theme. You can always change the color of the font for the theme.
Customizing a Table
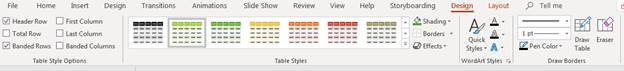
After you create a table, you can customize the way it looks. The "Design" tab is activated when you create a table, and this menu has several options where you can change colors and styles.
(Design menu)
The first section labeled "Table Style Options" configure header columns and rows. By default, the "Header Row" checkbox is selected, which displays a darker color in the first row to indicate that it's a header row. You can apply this darker color to the first column to give your rows a header section as well. The "Banded Rows" option displays alternative light and dark colors to make it easier to distinguish each row. The "Total Row" option sets a darker color at the bottom of a table for data such as a total when you have a list of numbers. You can do the same styles with columns. Use this section to make certain sections of your table stand out.
The "Table Styles" section is where you set the color styles for the table. By default PowerPoint 2019 chooses a color style that matches your theme, but you can choose any style from this section to change coloration. Color combinations include a flat color with a darker and lighter option to set header and branded rows.
In the "Table Styles" section is the "Effects" dropdown. This feature applies shadow effects on the table and its cells. You can see an example of the effects when you click the button.
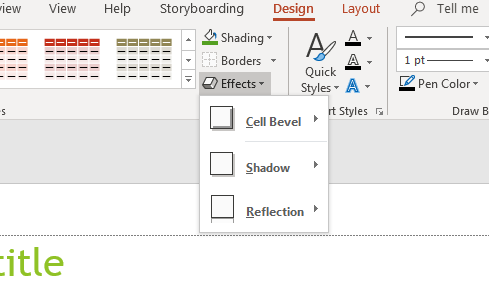
(Table shadow effects options)
Each section has a submenu where you can choose the effect. Choose one of the shadow effects, and it's applied to the table. Should you decide that you don't like the effect, click the "Undo" button in PowerPoint's quickbar.
WordArt styles fill in text colors, outlines, and text effects. Text effects are unique filters applied to fonts that give them additional looks aside from colors and font styles.
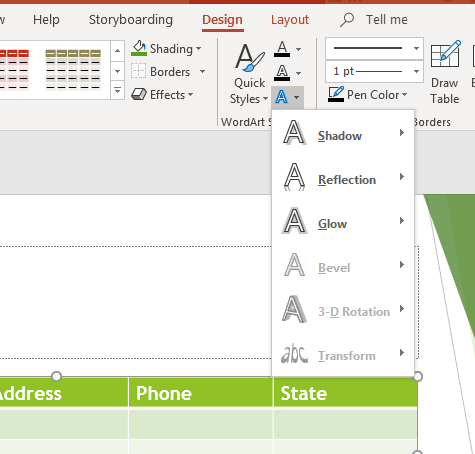
(Text effect options)
In the "Text Effects" dropdown, a thumbnail of the effect is shown. This lets you know what your text will look like after you click the effect. Each effect has a submenu where you can choose an effect based on the main one. For instance, the "Shadow" text effect will have options to show the shadow to the right, left, top or bottom of the text. Click the effect and it's applied to the selected text object. If you have a portion of the text selected, then the effect applies to only the selected content.
The "Draw Borders" section applies borders to every cell, a portion of cells, or the entire outline of the table. Borders are useful when you need to make a table stand out and separate each field with an outline in addition to the alternative colors using a branded effect. You can customize border colors using the "Pen Color" dropdown, so that these borders match your overall theme.
You can also change the size and style of a border. The default select for the size of a border is "1 pt," which is shown in the dropdown above the "Pen Color" dropdown. Above this dropdown is the border style. The default style for any border is a solid, single line. You can change this style to a dashed or dotted line, or you can change a single border line to a double line with dotted lines.
The final option is to add more table elements to your slide after you've completed the original table. In the "Draw borders" section of the menu, a "Draw Table" button can be used to create table elements. Click it and draw a table element anywhere in your slide. You can also colorize and style these elements as well as add effects. Use these elements when you need to add just one more cell somewhere on the slide but don't need an entirely new table.
Should you change your mind about any elements on the original table or the new ones that you created, you can use the "Eraser" button. Click this button, and an eraser icon displays. Hover the eraser over an element and click it. The element is deleted. Should you change your mind, click the "Undo" button.