You can add formulas in Crystal Reports to calculate values and summarize your data. If we use our report as an example, we can use a formula to add up how many customers we have listed.
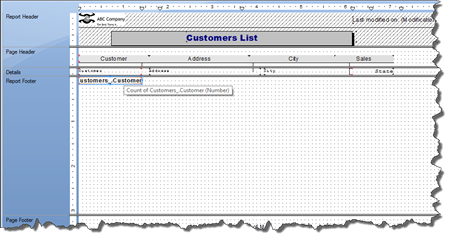
Our report is shown below.
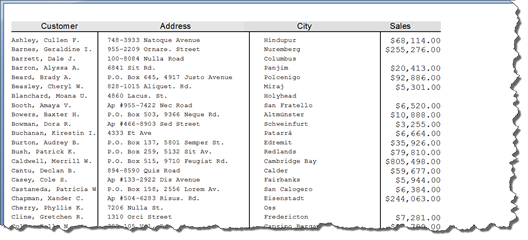
To calculate how many customers we have, we would go to Insert>Summary.
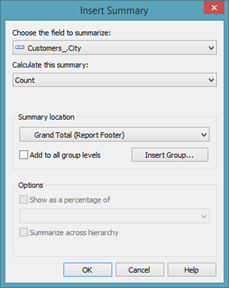
The Insert Summary dialogue box appears.
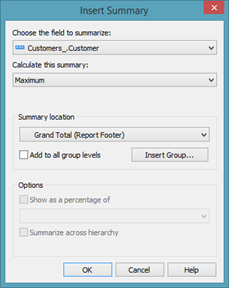
In the Choose Field to Summarize dropdown, choose the field that you want to use to create a summary. We chose our Customer field.
In the Calculate This Summary Field, choose the function that you want the formula to perform.
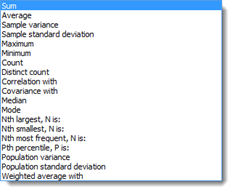
We want to count how many customers, so we choose Count.
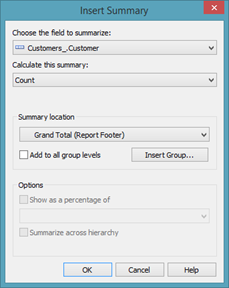
In the Summary Location field, choose where you want the results displayed. Our report doesn't have any groups added to it. For that reason, the results will have to be displayed in the Report Footer.
Click OK.
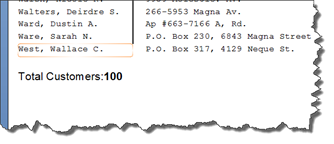
You can then see the grand total on the last page of the report in the Report Footer section.
If our report would have contained a group, we could have had the results appear in the Group Footer.
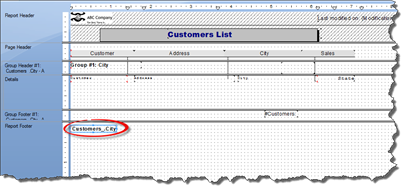
Now, let's go to Design view.
We can see the summary field added. If we wanted, we could now move it to the Report Header.
Subtotal Fields
In the last section, we added a grand total field. Subtotal fields can also be added to your reports; however, you must have grouping on your report in order to add a subtotal field.
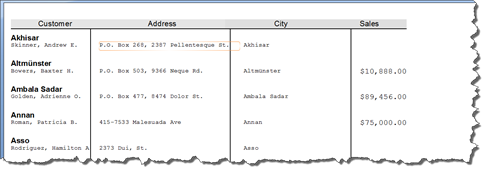
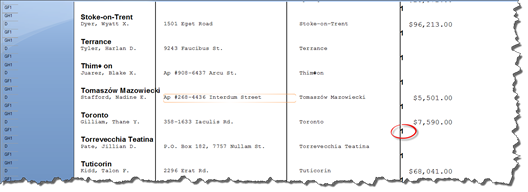
In our report shown below, we have our customers grouped by city.
If, for example, we wanted a subtotal to show the number of customers in Toronto, we would go to Insert>Summary.
Next, in the Choose the Field to Summarize dropdown, we would choose the City field.
Once again, we would choose Count from the Calculate This Summary dropdown.
Now, in the Summary Location dropdown, we would choose the group.
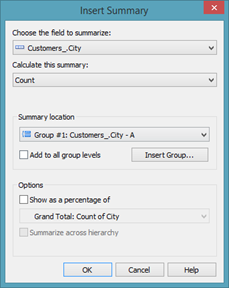
Click OK.
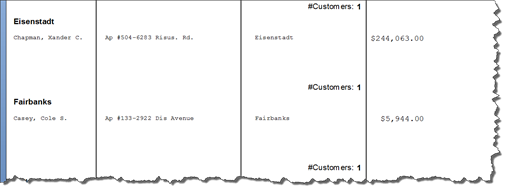
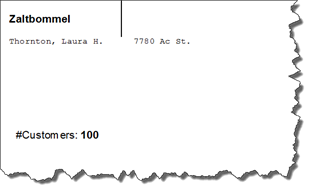
As you can see below, the subtotals for the number of customers in each city is displayed in the Group Footer sections.
If we wanted, we could then add a text object to create a label for the subtotal fields.
Displaying a Percentage of a Grand Total
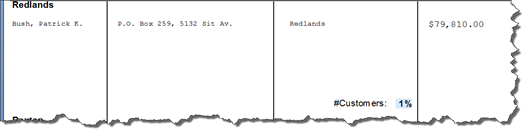
In the last section, we displayed a count for the subtotal. Instead, if we wanted, we could display the subtotal as a percentage of the grand total. For example, we could display the percentage of customers who live on Toronto.
To do this, select a subtotal summary field, then right click on it.
Choose Edit Summary from the context menu.
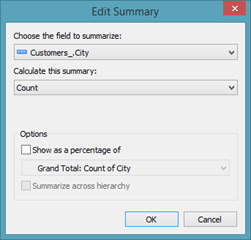
Put a checkmark in the box beside Show as a Percentage of.
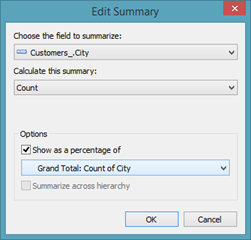
Choose the grand total field from the dropdown menu. The results displayed will be a percentage of the grand total.
Click OK.
Moving Summary Fields
One of the neat things about summary fields is that you can move them. When you move them, the field will be recalculated to provide an accurate summary based on the location to which it was moved.
In the last section, we created a subtotal of the number of customers in each city. If we look at Design view, we can see the summary field located in the Group Footer section.
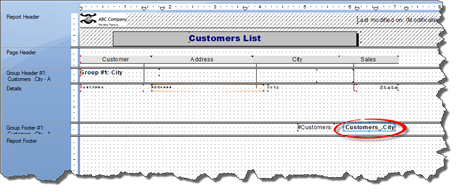
We can take that summary field, and drag it to the Report Footer section.
When we do, the field is recalculated to reflect the total number of customers, as shown in Preview:
Using Sum, Average, Minimum and Maximum in Summary Fields
Thus far in this article, we've used "count" as the function for our summary fields.
To do this, we go to Insert>Summary, we then see the Insert Summary dialogue box.

From there, we choose the field for which to create the summary, then the function we want to use.
In addition to count, we can choose:
-
Sum to add up the values.
-
Average to average the values.
-
Maximum to display the greatest value.
-
Minimum to display the smallest value.
Creating a Summary Report
There may be times when you want to create a report that shows summary fields only.
Let's take a look at an example.
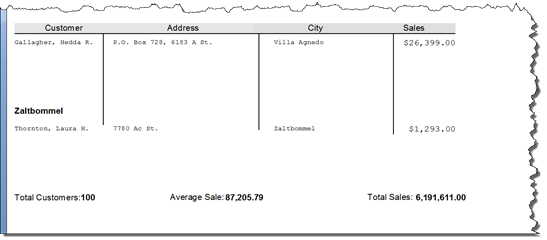
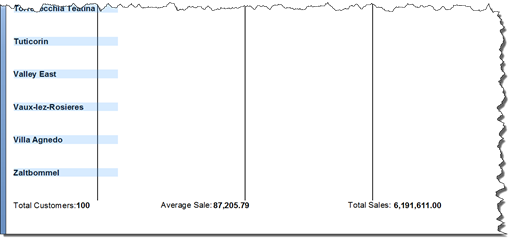
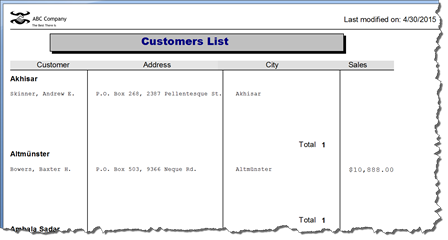
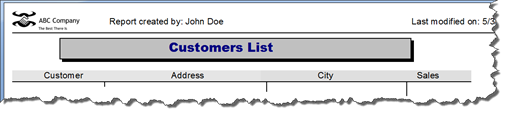
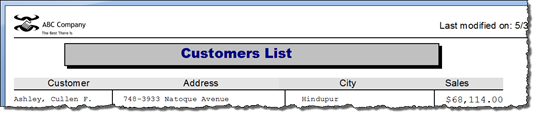
In our report below, you can see three summary fields in the Report Footer. We have the total number of customers, the total amount in sales for those customers, and the average amount per sale.
For this report, we used the data from the data sources to create the summary fields. However, we don't need the data in the Details section displayed in our report. The only data we need displayed is that which is found in the summary fields. In other words, we want to create a summary report.
To create a summary report, go to Design view.
Right click on the Details section, then choose Suppress from the context menu.
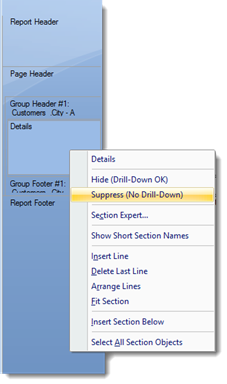
This hides the Details section.
Go back to Preview.
As you can see below, the Details section is now hidden. However, you can still see the groups.
To remove the grouping, go to Report>Group Expert and remove the grouping.
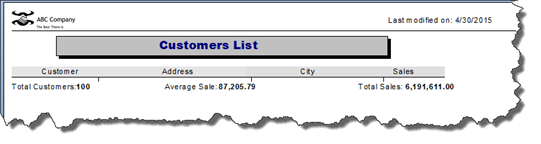
Now we can delete the field headings, as well as the vertical lines.
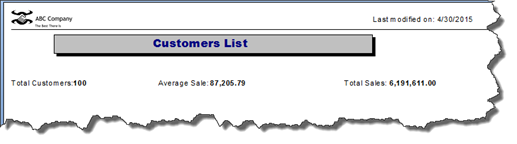
We could even change the name of the report from "Customers List" to "Sales Report."
Creating a Drilldown Report
To hide or suppress a section in your report, you go to Design view, right click on the section, and then choose either Hide or Suppress. We've used both Hide and Suppress interchangeably, and we haven't discussed the difference between the two.
Let's look at the difference.
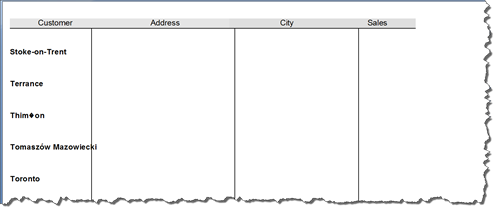
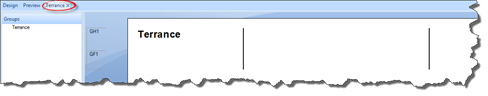
In our report below, we have suppressed the Details section by going to Design view, right clicking on the Details section, and choosing Suppress.
When we go to Preview, we only see headings. The data in the Details section isn't displayed.
You can double click any of the group headings, and the data under that group heading will be displayed in its own tab.
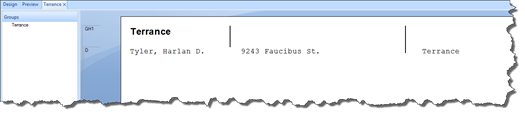
We are going to double click on "Terrance."
As you can see in the snapshot above, a new tab appears. However, we have suppressed the data. Because we suppressed the data, we see only the group heading in our report.
Let's close out the tab and return to our report, then return to Design view.
We are going to right click on the Details section again. This time we are going to select Don't Suppress. We don't want to hide the data in the Details section.
Go back to Preview once again. We can see our data in the Details section.
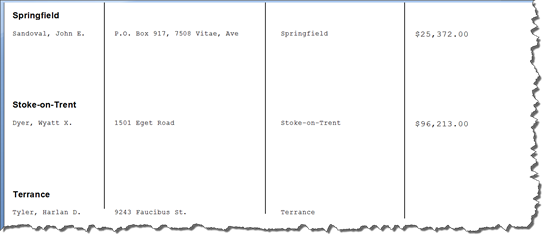
We double click on Terrance.
We can see the data under Terrance.
Let's close out the new tab, and once again return to Design view.
This time, we are going to right click on the Details section, then choose Hide � or Drill-Down OK.
When we go to Preview, our data in the Details section is hidden � just as it was when we suppressed the data.
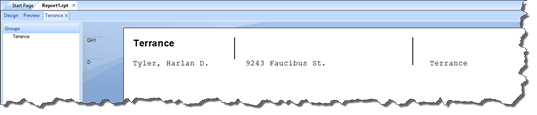
Let's double-click on Terrance again.
As you can see, the data is displayed below the group heading in the new tab. This is a drilldown report.
We can now double click other group headings in the Preview tab.
If you need to refresh the data in a drilldown report, go back to Preview and click the Refresh button.

You will see the following message, alerting you that your drilldown reports will be closed.
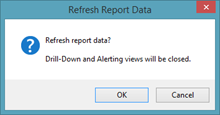
Click OK.
The data in your report is then refreshed. You can double click on any group heading to open up a drilldown report.
Sorting by Group Summary Values Instead of Group Headings
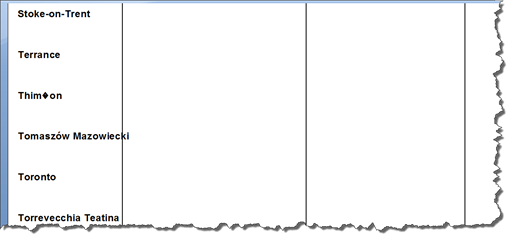
If you look at our report below, you can see that right now our groups are sorted by the group names. The names are in alphabetical order.
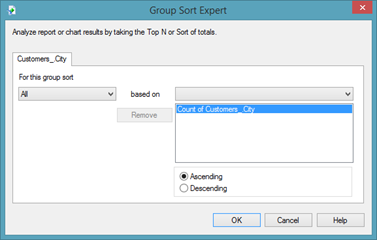
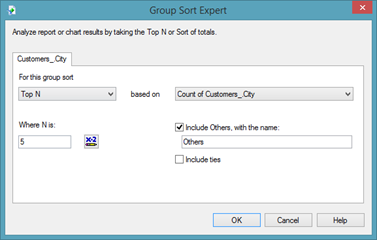
If we wanted to sort by the subtotal values instead of the group headings, we would go to Report>Group Sort Expert.
![]()
In the For This Group Sort dropdown, you can choose:
-
All which sorts by all totals or subtotals.
-
Top N, which sorts the top values in your data summary fields. You can choose the top 5 values, top 10, et cetera, by specifying the number in the Where N Is field. "N" is a value that you define. You can decide to include the other totals or subtotals by putting a checkmark beside Include Others, With the Name. You can also include ties � or values that are the same � in the sort, which may mean more than the top 5 is displayed.
-
Bottom N, which sorts the specified number of the lowest totals or subtotals.
![]()
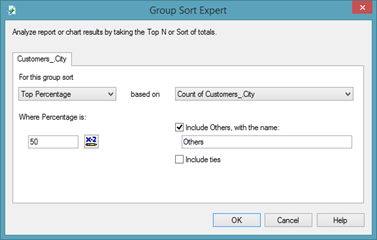
Top Percentage, which sorts by a specified top percentage of totals or subtotals.
![]()
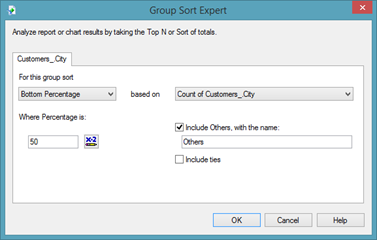
Bottom Percentage, which sorts by a specified bottom percentage of totals or subtotals.
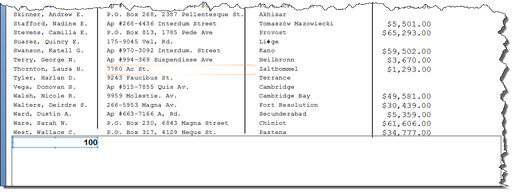
For the purpose of this article, we are going to choose to sort by All.
Now we can see the subtotal field available. If there were other fields available to sort by, those would appear in the dropdown.
Click OK.
Working with Parameter Fields
In Crystal Reports, parameter fields allow users to enter information, typically to find data within the report. The parameter field serves as a live filter that enables the user to see the data that meets the criteria that he/she selects.
Adding a Parameter Field
To better understand how parameter fields work in Crystal Reports, let's learn to add a simple text parameter field.
For this example, we are going to add a field that will produce the name of the person who created the report. Let's say we have three people with access to our report in Crystal Reports. Each person accesses the report from time to time to refresh the data in the report as it is updated in the data sources. What we want to do is add a parameter field to the report that will let us know who refreshed the data in the current version of the report.
To make this happen, we will create a prompt that allows the user to enter a text string. The text string will be the name of the person working on the report. The name will appear in the parameter field in the report.
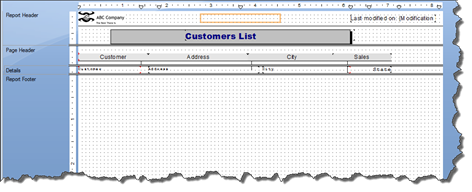
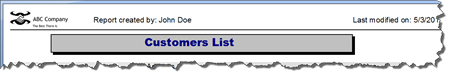
Take a look at our example below.
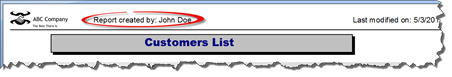
As you can see, the latest version of our report was created by John Doe.
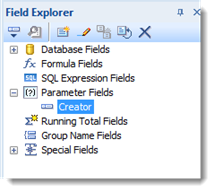
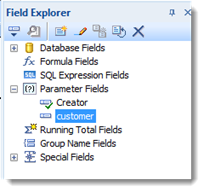
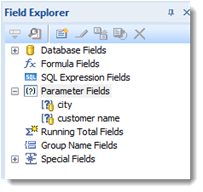
To create the parameter field, go to the Field Explorer panel. You will see a section called Parameter Fields, as highlighted in blue below.
![]()
Select Parameter Fields, then right click on it.
Select New.
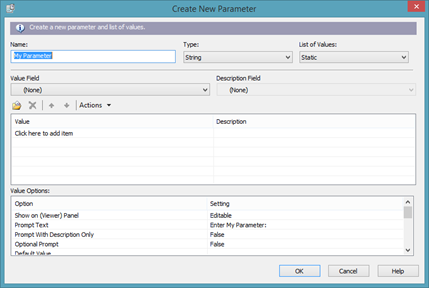
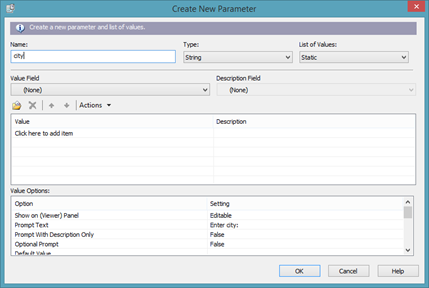
You will then see the Create New Parameter dialogue box.

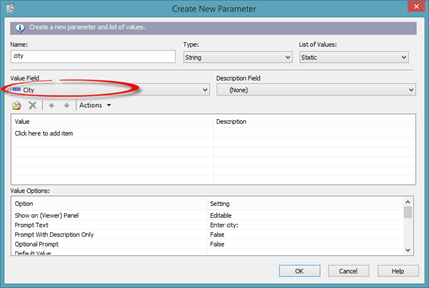
In the Name field, enter a name for the parameter field. We want to find the name of the person who created the report, so we are going to enter "Creator" in ours.
Next, enter the type in the Type field. We knows ours will be string � or text, but we could also choose currency, number, date, date time, et cetera.
In the List of Values field, we want to leave it as static since it is a static value.

The section circled in red below is what we would use if we wanted to furnish a dropdown list. We will learn more about that later.
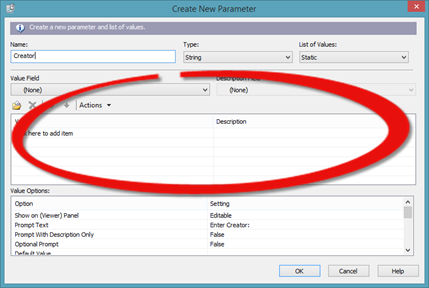
Instead, go to the Value Options section.
Take a look at the Show on (Viewer) panel option. This option allows viewers to see the parameter in the Parameter panel on the left side of the Crystal reports window.
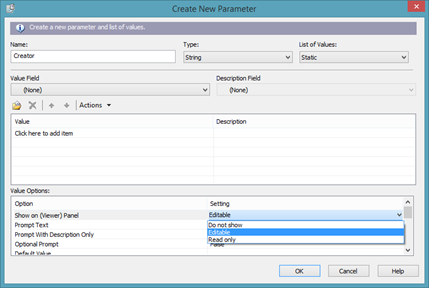
If we click on Editable for that option, we see that we can change the setting to Do Not Show or Read Only. We want to leave it as editable. Leaving it as editable means that users can filter from the Parameters panel.
Next, look at the Prompt Text option. This is the text that will appear to prompt the user's response.

Right now, it is Enter Creator. If we wanted to change it, we could click on the setting for the option.
Next, look at the Allow Custom Values option.
![]()
It is set to True. We want to leave it at True, because we want the user to be able to enter whatever values they want.
The Allow Multiple Values is set to False.
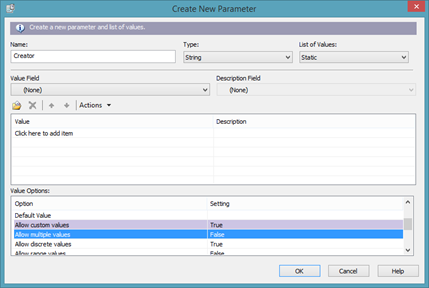
We also want to leave this option as it is at False, because we don't want the user to be able to enter in multiple values.
Click OK.
You will now see it listed in Field Explorer in the Parameter Fields section.
Now that it's listed in Field Explorer, we have to add it to our report.
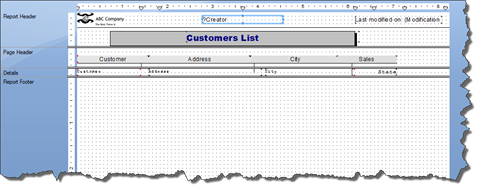
Let's go to Design view, and drag the Creator field to the Report Header section.
You can now see the field in Design view. Parameter fields all have a question mark (?) before the name of the field. You can see the question mark before "Creator" in our parameter field pictured below.
Next, we need to add a text label (a text object) for the parameter field.
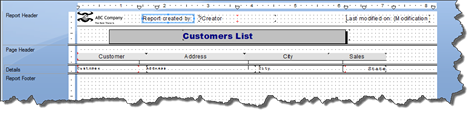
Once we've added the text label, we can go to Preview.
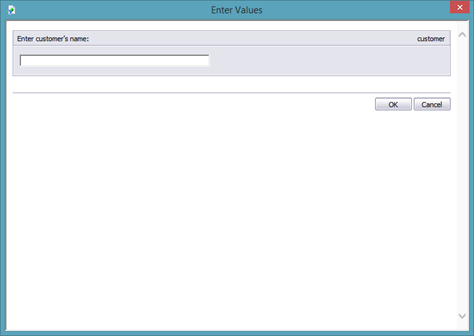
Since it's our first time running the parameter, there's not a saved value for the Crystal Reports to use. Because of this, we will see the Enter Values dialogue box.
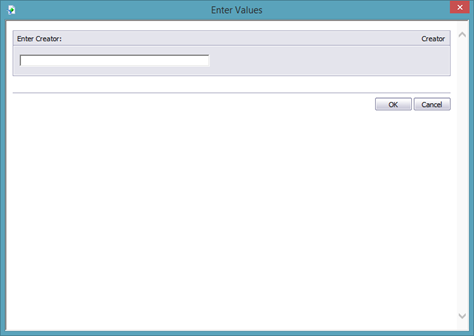
We will have to enter the report creator's name.
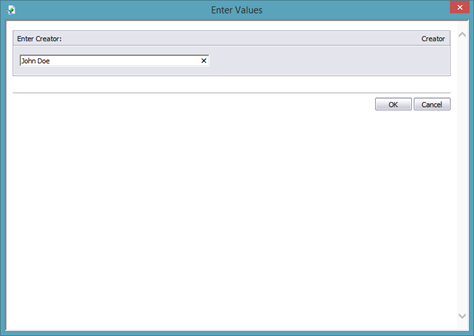
Click OK.
You can see our label and parameter field in the snapshot above.
Filtering Data with a Text Parameter Field
Now let's use a text parameter field to filter data in a report. We want to use it to find customer names.
Start out by going to Field Explorer and creating a new parameter.
You will then see the Create New Parameter dialogue box.
Enter a name for the new parameter. We're going to name ours "customer."
Enter a type for the new parameter. Since it's text, we'll leave it as String.
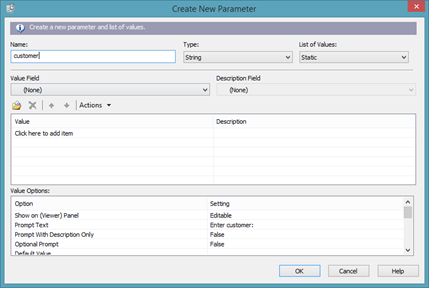
Now, go down to the Value Options.
Go to the Prompt Text option. This is the prompt that users will see.
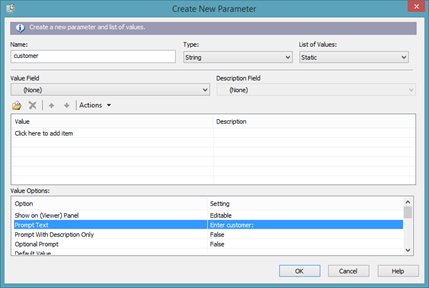
We are going to click on the setting for this option, and change it to "Enter customer's name:"

Click OK.
The parameter field now appears in Field Explorer.
Now we have to set up the filter.
Next, go to Report>Select Expert>Record.
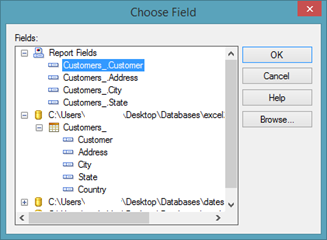
We want to filter by customer names, so we choose the Customers_.Customer field.
Click OK.
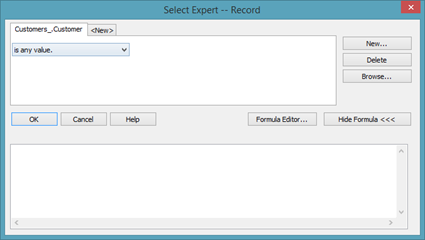
We want to filter this field by values that are equal to the parameter field that we just created.

Click OK.
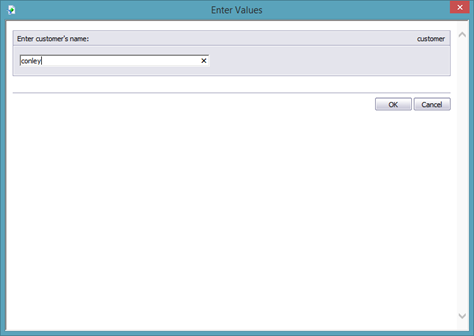
We are going to enter Smith to see how many customers we have with the last name Smith.

Click OK.
You can see that we don't have any.
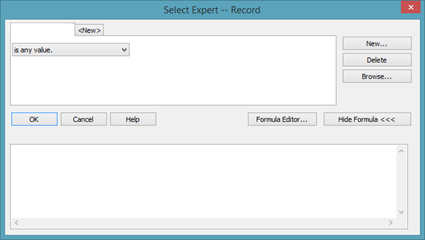
If we wanted to search for new values � or other customers, we can click Refresh on the Navigation toolbar.
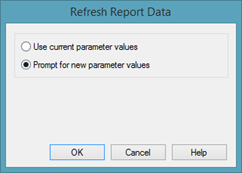
Select Prompt for New Parameter Values, then click OK.
This time we entered "ashley".
Click OK.
Filtering Data with Number Parameter Fields
Now let's create a number parameter field that we can use to filter our data. We want to filter our sales so we can see which customers spent a certain amount of money with our company.
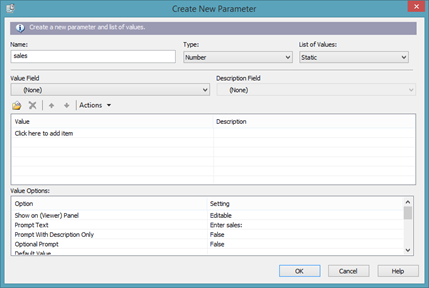
To start, go to the Field Explorer panel and create a new parameter field.
![]()
We want to be able to filter the sales numbers, so we are going to name the field Sales, then choose Number as the Type.
In the Value Options section, scroll down to Allow Range Values.
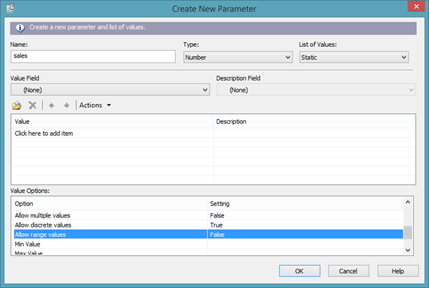
Right now, the setting for this is False, meaning users cannot enter a range of values. We want them to be able to enter a range, so we change the setting to True.
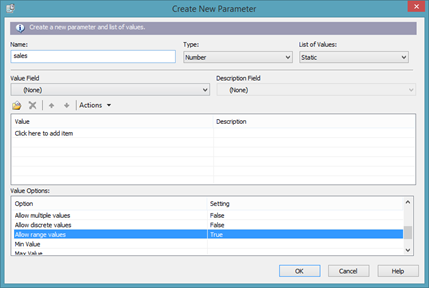
Click OK.
The new parameter field is now created in Field Explorer.
Next, go to Report>Select Expert>Record.
Select the field that you want to filter by, then click OK.

We want to set it as "equal to", then select the parameter field, just as we did with the text parameter field.
Click OK.
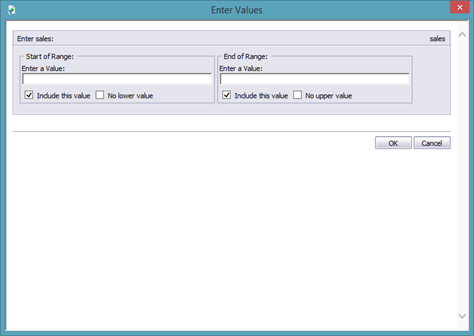
Now you can enter a value for the start of the range, then a value for the end of the range.
Press OK, and the results will appear in your report.
Filtering Data with a Date Parameter Field
Next let's create a parameter field to filter dates.
To start, go to the Field Explorer panel and create a new parameter field.
![]()
We want to filter for date of purchase, so we're going to name the parameter field "purchase date".
For the type, select Date Time. You must select Date Time to create a date parameter field to filter data. If you just select Date, then it will not show up in the Select Expert when you go to create the filter.
If we want, we can allow a range of options in the Value Options section.
Click OK.
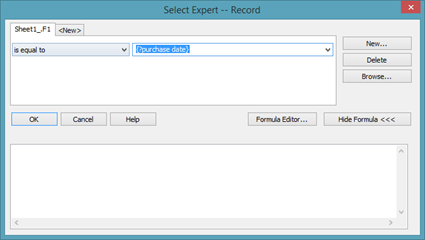
Now, go to the Select Expert. Select the date field you want to use to filter.
![]()
Click OK.
We want to set it as "equal to", then select the parameter field, just as we did with the text parameter field.
Click OK.
![]()
You can click the little calendar icon to the right of each value field to select a date.
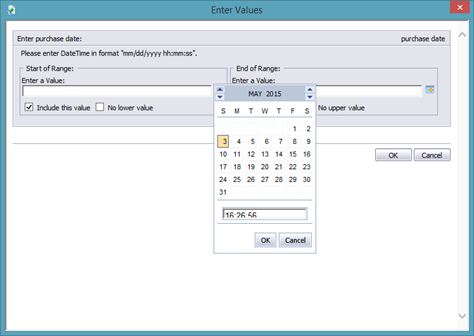
Click OK after you've entered a starting and ending range value.
Creating a Dropdown List Parameter
So far, we have created parameter fields where the user had to type in a value. However, we can also create parameter fields that have a dropdown list. The user will be required to choose one of the options in the dropdown list.
We are going to create a drop list that requires the user to choose a city from a dropdown list.
To do that, let's create a new parameter field in the Field Explorer panel.

As you can see above, we named our new field "city". Since it's a text field, we left the type at String.
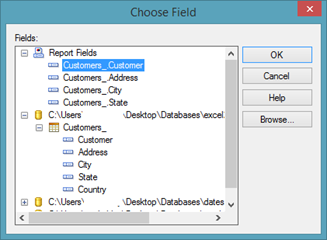
Next, in the Value Field dropdown, select a value. Since we want to create a dropdown that contains cities, we are going to choose the field that contains city names.
Next, click Actions (below Value Field), and select Append All Database Values from the dropdown.
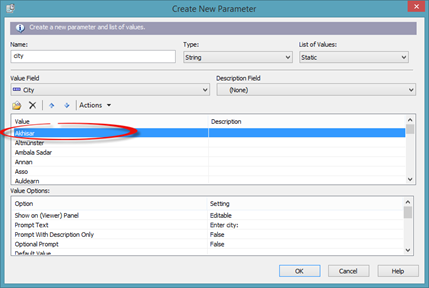
As you can see above, the cities are then added.
Set any options that you want, such as multiple values to allow users to pick more than once choice, then click OK.
The new parameter field then appears in Field Explorer.
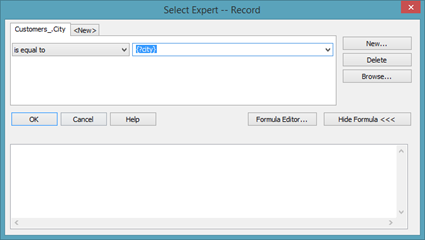
Next, go to the Select Expert.

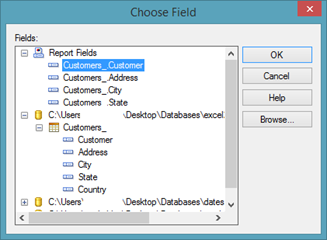
Select the field you want to use. For us, it will be Customers_.City.
Click OK.

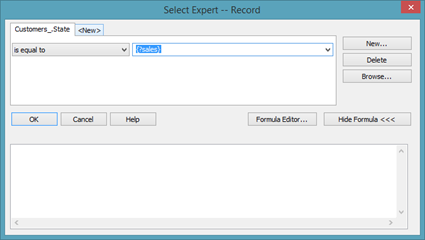
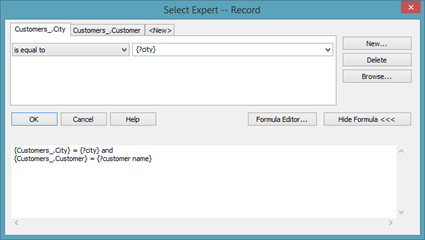
Just as with the other parameter fields, select "is equal to," then select the parameter you just created.
Click OK.
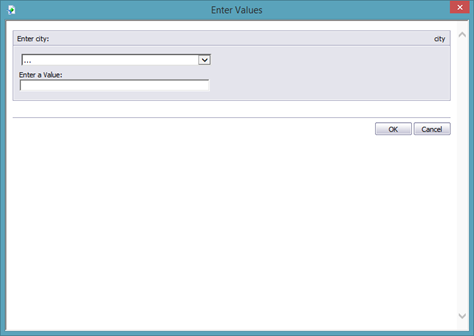
You can then see the dropdown list beneath Enter City.
Let's enter Toronto.
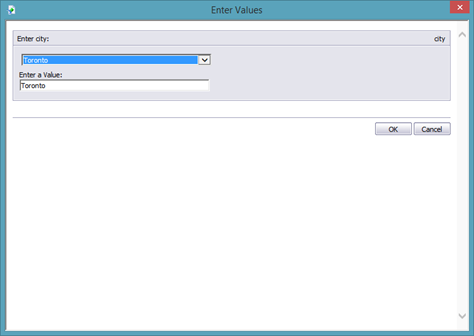
Click OK.
![]()
Dynamic Dropdown Lists
In the last section of this article, we created a static dropdown list. This means that the data displayed in our dropdown list was data generated from our report at the time we created the parameter field.
It's fine to create static dropdown lists that way.
However, a problem can occur over time when you create static dropdown lists. In our example, we used our City field to create the list. Over time, we may get customers from new cities. We may no longer have customers who live in the cities on our list. Because we created a static dropdown list, the dropdown list will not be updated to reflect the changing data.
Instead, we can create a dynamic dropdown list.
To do this, the first thing we have to do is create a new parameter field as we've done all throughout this article.
We have named the parameter field "city."
The type is String.
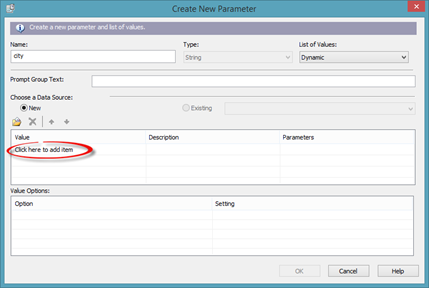
In the List of Values field, we are going to choose Dynamic. Thus far in this article, we've chosen Static. This time, we choose Dynamic.
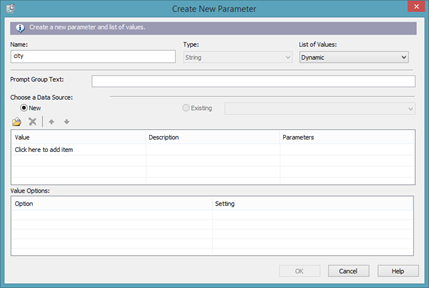
You can see in the snapshot above that the Create New Parameter dialogue box takes on a different look.
Click "Click Here to Add an Item."
Choose the field you want to use. For our example, it will be our City field.
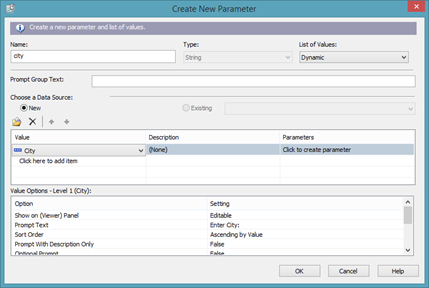
Next, go to the Parameters column for the field you just added. Click on "Click to Create Parameter."
![]()
You just have to click it. You don't have to do anything else.
Click OK.
Now that we've created the parameter field, it's time to go back to the Select Expert.
Choose the field.
Click OK.
By now, you would know to choose "is equal to," then select the new parameter field.

Click OK.
![]()
Creating Multiple Parameter Fields
You can add multiple parameter fields to your report to enable users to better filter the data.
To add multiple parameter fields, first create the parameter fields that you need in the Field Explorer panel.
We've created two.
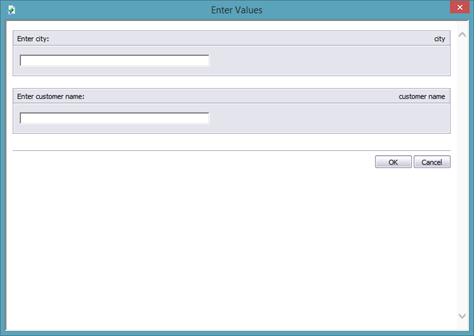
Next, go to the Select Expert and select the filter criteria for each parameter field, as you've learned to do throughout this article.
NOTE: Do not click OK in the Select Expert until you've entered the filter criteria for all fields. In the snapshot below, we've entered the criteria for the City field. We will click New to enter it for the next field, which will be our Sales field.
Click the New button to enter the filter criteria for the next parameter field.
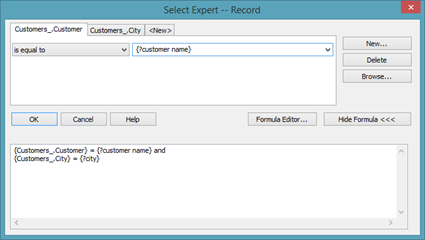
Click OK when you are finished.
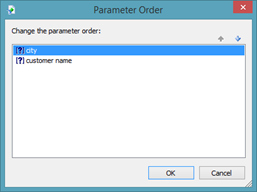
If you want to change the order of your parameter fields, you can do so by going to Field Explorer, right clicking on Parameter fields, then selecting Set Parameter Order.
Deleting a Parameter Field
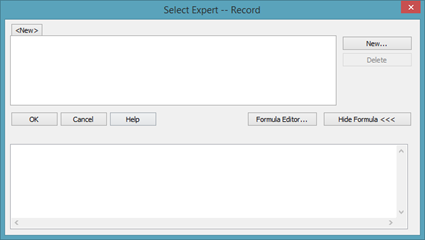
To delete a parameter field, you first have to delete the filter in the Select Expert.
Let's go to the Select Expert.
Select the field for which you want to delete the parameter field, then click the Delete button.
We are going to delete both.
Click OK.
![]()
Click Refresh Data.
You can now go to the Field Explorer panel, right click on a parameter field, then select Delete to delete the parameter field.