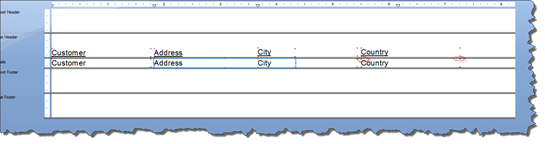
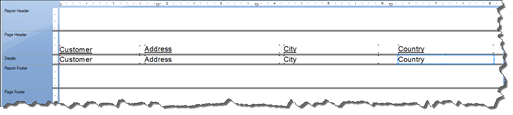
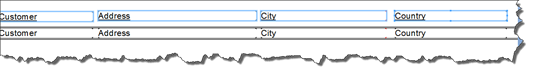
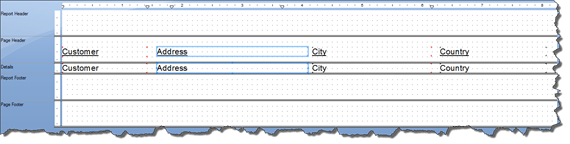
If we take a look at the Preview of our report, we can see the sections of the report labeled on the far right. We can see the Report Header section (RH), the Page Header section (PH), and we can also see the Details sections of our report. As you can see below, each row of data is one Details section.
![]()
That said, let's break down a report even further. Each piece of data contained in the fields of your report is a data object.
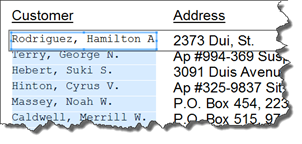
By going to either Preview or Design view, we can click on any data object to select it.
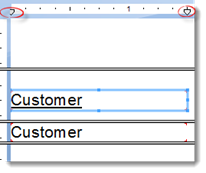
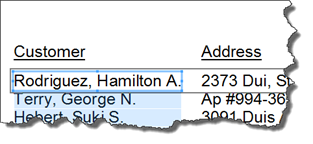
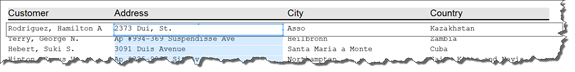
In Preview, we've clicked on the name of the first customer. You can see a bounding box appear around the data object, along with four handles.
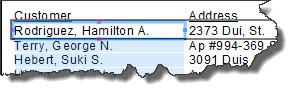
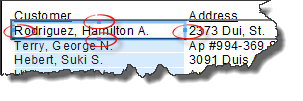
We've circled the handles in the snapshot below.
As we take this article to learn how to apply formatting to your report, we will learn how to work with the individual data objects.
Resizing Data Objects
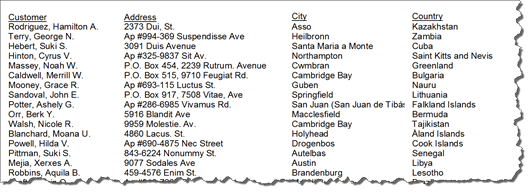
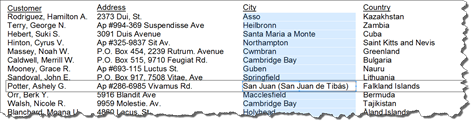
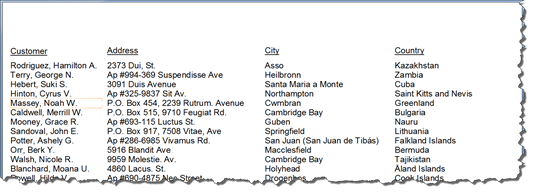
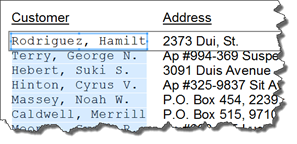
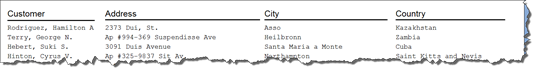
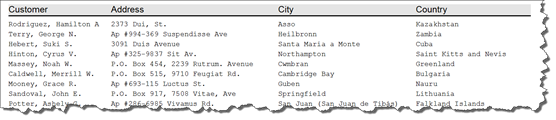
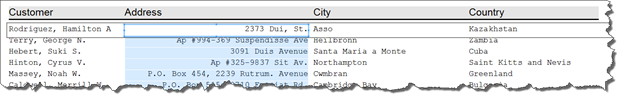
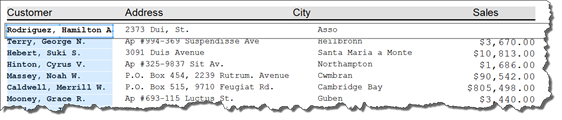
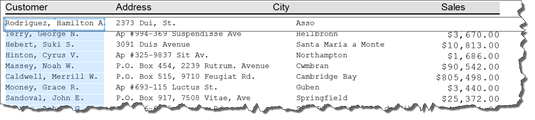
Take a look at the preview of our report below.
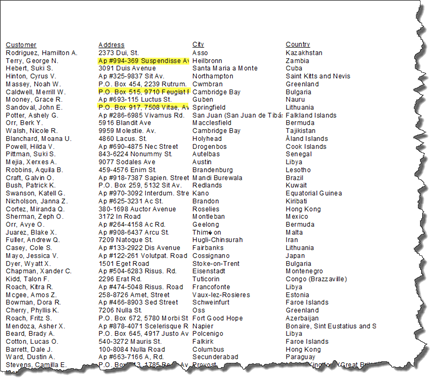
As you can see, we have highlighted some of the data in the Address field. We have highlighted these fields because the addresses were cut off. There wasn't enough space for the entire address to appear.
We can resize any data object by selecting the data object, then using the handles to resize it.
You can resize data objects in Preview or Design view. We are going to remain in Preview.
To resize a data object, select the data object that you want to resize.
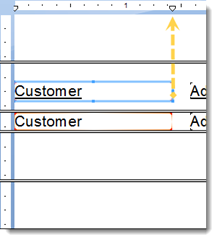
Hover your mouse over one of the handles until your cursor turns into a two way arrow that looks like this:

We've chosen the handle on the right side of the data object, because we want to expand the width of the data object.
Once you see the two way arrow, you can then drag your mouse to change the size of the data object, as we've done below.
NOTE: When you change the size of one data object in a field, you change the size of all data objects in that field.
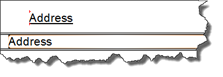
If you look at the snapshot above, you can see that the entire address is now displayed; however, it now bleeds over into the City field. Don't worry about that for the time being. We will show you how to fix that in a second.
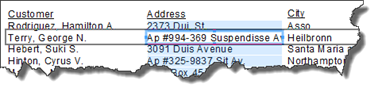
For now, scroll down through your report to make sure all addresses are completely showing. In other words, make sure you've expanded the size of the data object so that all addresses in the field are completely showing.
We found one that still needs to be resized so that the entire address shows.
To resize it, select the data object and then drag on the handles.
Follow these steps to resize data objects. The purpose of resizing data objects is to not only make your report more readable, but to make it more visually attractive.
Moving Data Objects
In the last section, we saw how our address bled over into the City field when we resized our data object. In this section, we are going to learn how to fix that by moving data objects.
While you can move data objects in Preview, it's easier to use Design view to do this. The reason is that Design view shows you where a data object begins and ends.
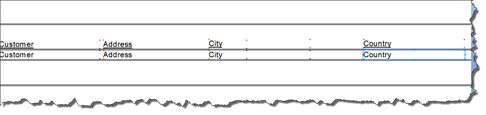
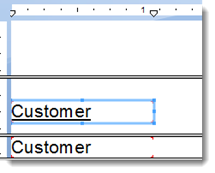
In the snapshot below, we have circled the marks that signify where our Country data object begins and ends.
By looking at the snapshot, we can also see that our data object in the Address field is overlapping the data object in the City field.
To fix this, we are going to move the Country data object to the right, followed by the City data object. When we move one data object in a field, we move them all. In other words, we don't have to worry about aligning all the Details sections of the report.
To move a data object, click on it to select it. A blue bounding box appears around it, as shown above.
Hover your mouse above the data object until you see a four way arrow, then drag and drop the data object to its new location.
Below, we've moved Country to the right.
Now let's move City.
NOTE: Remember to move the data object in the Details section, not the Page Header section.
Once we've moved the City data object, we can click on the Address data object again.
It no longer overlaps City.
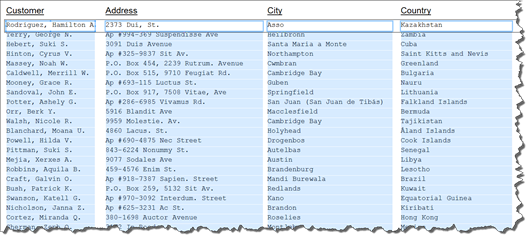
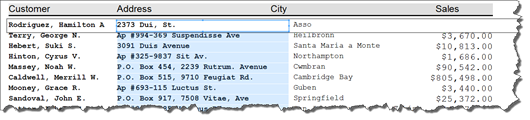
Next, go back to Preview to make sure that none of the Address data objects overlap the City data objects.
Take a look at the snapshot above. The Address fields all look okay now, but notice that a City field is cut off by a Country field.
You will want to go through your report and adjust the sizes of the data objects until your report looks the way you want it. Keep in mind that you can also reduce the size of data objects if there is a lot of white space after the data.
For example, look at our Name data object below. This is the longest name in our report, and there is a lot of white space after the "A."
We can reduce the size of the Name data object by hovering over the handle on the right side and dragging to the left
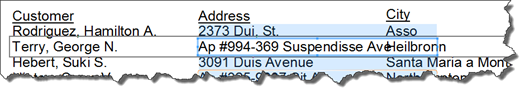
Now we can go back to Design view and move the Address and City data objects � also to the left.
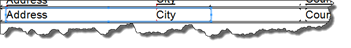
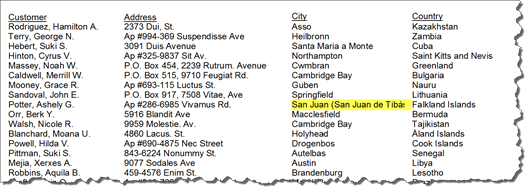
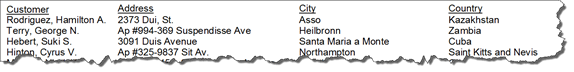
If we go back to Preview once again, we can adjust the size of the City data object so the entire name of the city is visible.
![]()
Simply drag on the handle of the City object to resize it.
Moving Page Headers
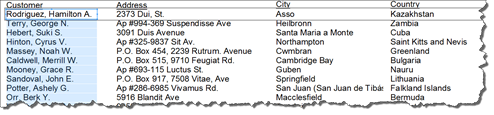
If you look at our report in Preview, you can see that our field headings in the Page Header section appear close to the data fields. In fact, they're so close, they could be mistaken as data fields.
To move field headings, go to Design view.
Select all the field headings so the changes you make are universal. Use CTRL+ Click to select all of the field headings.
The last field heading that you select will be the only field heading that will have handles. This is the page header object that you will use to move all the field headings.
In our example, it is "Country."
To move the field heading, hover your mouse over the field heading until you see the four way arrow. Click and drag the field heading.
You can also resize a field heading by hovering your mouse over one of the handles until you see the two way arrow, then dragging to resize. However, this will not resize the text.
Let's go back to Preview, and see our report now that we've moved the page header.
Our report is starting to look a lot better. However, let's learn some additional ways that we can format the report to make it even more attractive.
Using Ruler Guides
Whenever you drop a field on a report, you'll see guides appear in the ruler for that data field. The left hand guide controls the left hand side position of your field.
The right hand guide controls the right hand side of the data object. The left hand guide controls the left side of the data object.
You can slide a guide to resize the data object.
You can use these guides to align your fields as you want them on your report.
To delete a guide, select it and drag it off the ruler.
To add a guide, place your mouse over the side of the data object, then draw an invisible straight line up to the ruler. Click on the ruler to add the guide.
Aligning Field Headings and Data Objects
Next, let's learn to align field headings with data objects.
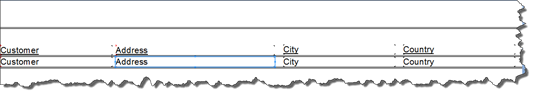
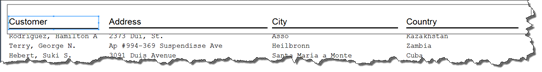
If you look at the snapshot below, you can see our Address heading is out of alignment with the Address data object.
To fix this, CTRL+ Click to select both.
Right click on the one that you want to align the other to. In our example, the data object is where it should be, and we want the field heading aligned to the data object. For that reason, we will right click on the data object. Again, it's the object we want to align the field heading to. We want to align to the left.
We right click on the data object.
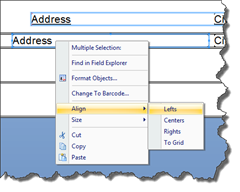
From the context menu, we choose Align>Lefts.
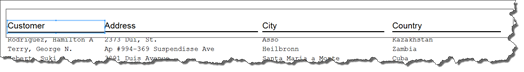
As you can see, our field heading and data object are now aligned.
Snap to Grid
The Snap to Grid feature in Crystal Reports isn't anything you really need to learn how to use, because you use it automatically every time you drop a field onto your report. All objects are snapped to the nearest grid point when you drop them.
However, if you want to view the grid and use it to be more precise when you drop objects, go to View>Grid>Design to view it in Design view.
You can then see all the grid points in your report.
If you zoom in, you can get an even better view of the grid points. You can use the grid to snap objects to the grid.
![]()
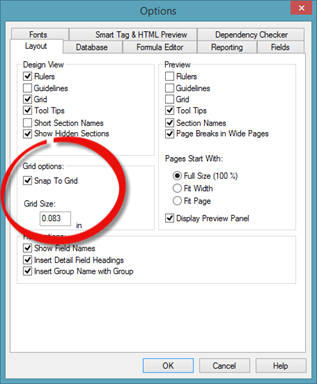
Snap to Grid is turned on by default. If you'd ever want to change the grid size or turn it off, you can do so by going to File>Options.
Working with Fonts
Once you have data added to your report, you may want to format the text that makes up the data. It's this toolbar that you'll use to change the font size, type, color, et cetera.
You can format the text of your report in Preview or Design view. The choice is yours.
To change the font type, select the data field you want to format.
Go to the Formatting toolbar and choose a new font type from the dropdown list.

We've changed our font to Courier New.
As you can see, when you change the font type for one data object in a field, you change the font type for all the data objects in the field.
Now that we've changed the font type, we may also want to change the font size. To do this, select the data object, then select a new font size from the Font Size dropdown menu, circled in red below.

You can also increase the font by one size by clicking the Increase Font Size button:

Or decrease it by one size using the Decrease Font Size button.

We changed our font size to 8.
To change the font color, click the Font Color button, as circled below.

You can also boldface, italicize, or underline text by selecting the data object, then clicking either the Bold, Italics, or Underline button.

If you wish to format all the data objects at once, you can do so by going to the Design view. Currently, we've only changed the font type and size for the Customers field.
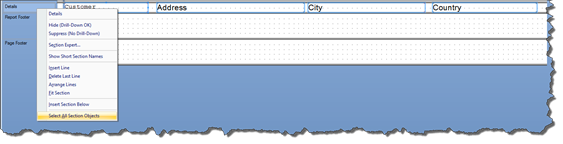
To do this, right click on the Details section (in the blue area).
Choose Select All Section Objects from the context menu.
Go ahead and make your formatting changes using the Formatting toolbar.
When you're finished, go back to Preview.
You can see that the formatting changes were applied to all data objects in your report.
You can follow the same steps to format all field headings in the Page Header section.
Adding Borders and Background Colors
You can also add borders and background colors to data objects and field headers to further customize the design of your report.
For the purpose of this article, we are going to add a border to our field headers. However, you can also apply these same steps to data objects.
The first thing we are going to do is go to Design view, then right click in the Page Header section, choosing Select All Section Objects to select all the field headings.
Next, we are going to go to Preview.
![]()
As you can see, all of the field headings are selected.
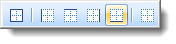
In the Formatting toolbar, we are going to click on the Outside Borders button.

When we click on the button, we are able to choose if we want to place borders on all sides of the field headings � or we can choose the side for which we want to add a border.
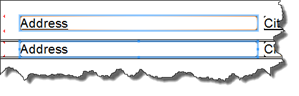
We are going to add a border on the bottom.
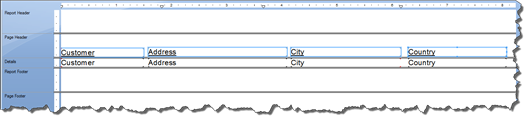
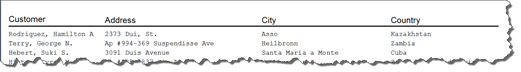
Take a look at our report.
You can see the bottom border added to each of our field headers.
Now, if we want, we can extend the rectangles to join each border and create a horizontal line.
Take a look at the snapshot below. You can see the rectangle around one of the field headers.
By extending the rectangle for this field header so that it touches the rectangle for the next field header, we can easily create that horizontal line.
Next, we can do the same for the rest of the field headers.
NOTE: Remember, if the bottom borders don't align perfectly, you can go back to Design view, then CTRL+ Click to select all the field editors, then align them as we learned to do earlier in this article.
Now that we've added a border, we can change the line style, line color, or even add a background color to our field headers.
To do this, go to Format>Format Objects.
You will then see the Format Editor.
Click on the Border tab.
You can change the line style for the top, bottom, left and right borders in the Line Style section. You can also add a drop shadow to your lines.
In the color section, you can change the color of the border.
If you want to add a background color to your field headers, put a checkmark beside Background, then choose a color.
Click OK when you're finished.
Aligning Text
In our report below, you can see that the text inside the rectangles is aligned to the left side of the rectangle.
Using the Formatting toolbar, we can change it so that the text is aligned to the right or center. We can even justify the text.
Right now, the Align Left button is selected, which lets us know the text is aligned to the left.

To align text to the right, we first select the data object as we've done above.
We then click the Align Right button on the toolbar.
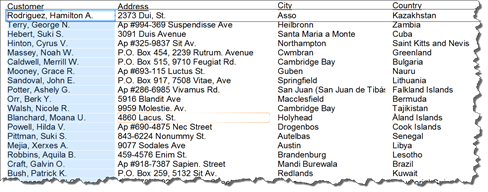
![]()
Notice how all the text in the field was aligned to the right.
We can also align the text to the center.

In addition, we can justify the text if you have a lot of text in a data field.

When you justify text, it will appear in block format.
Formatting Numerical and Money Data Fields
Thus far, we've only dealt with text � or string � data fields. However, you may have data fields that contain numbers or currency.
On the Formatting toolbar, you have a number of quick formatting options to format numbers and currency.
Let's take a look at those.
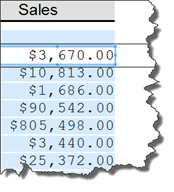
By clicking the dollar sign, you can quickly add a dollar sign to data in a data field.

By clicking the comma (or the Thousands button), you can add a comma for numbers that go into the thousands.

You can have the dollar sign and Thousands button active at the same time for larger currency.
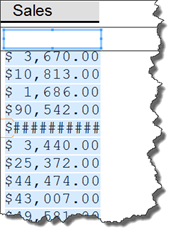
NOTE: If you see hashes in a data field, as shown below, it's because the number is too large for the data object. You will need to resize the data object.
You can also add a percentage sign to numbers in a data field.

If you have a number that's a decimal, you can increase decimal places.

You can also decrease decimal places.

These are quick formatting options.
You can also go to Format>Format Field. Click the Numbers tab.
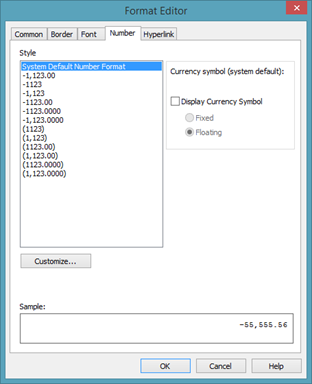
Select a numerical format from the list.
If you want to format currency, put a checkmark beside "Display Currency Symbol."
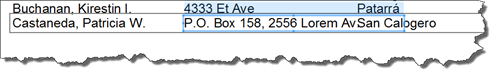
You can then choose to either have a fixed currency symbol where the currency symbol is aligned to the left side of the data object:
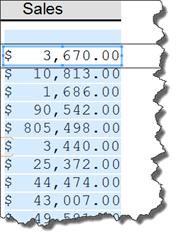
You can also choose floating, and it will be placed at the beginning of the numerical amount:
NOTE: You can format numbers in either the Preview or Design view.
Formatting the Date in Data Objects
You can also format data objects that contain the date or time.
To do this, select a data field that contains the date or time.
Go to Format>Format Fields.
Click on the Date and Time tab.
Note: The tab that appears is dependent on the type of field you have selected. In the last section, it was the number tab. When we had text selected, it was the Paragraph tab.
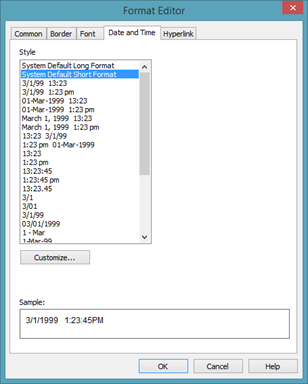
Choose the date and time format that you wish to use. You can choose a date and time combination for fields that contain date and time. You can also just select a date format or a time format.
Click OK when you are finished.
The Format Painter
The Format Painter lets you copy the formatting from one field and paste it onto another field.
The Format Painter is circled in red on the toolbar pictured below.

To use the Format Painter, click a data object that contains the formatting that you want to copy.
We've selected the data that has been boldfaced in the snapshot above.
Click on the Format Painter in the toolbar.
Next, click on the data object where you want to apply the formatting. Keep in mind that the formatting will be applied to the entire data field.
We've chosen to apply it to the Address data field.
Adding Hyperlinks to Data Fields
You can turn any data field into a hyperlink. This means that when anyone clicks on the data field, it will either take them to a location on your computer, on the Internet, or allow them to send you an email.
To turn a data field into a hyperlink, start out by selecting a data field.
You can then either right click and select Format Field, or go to Format>Format Field.
Click on the Hyperlink tab.
![]()
In the Hyperlink Type section, choose the type of hyperlink you want to create.
You can create:
-
No hyperlink, which is what we currently have.
-
A website on the Internet.
-
A current website field value. This means the data in the data object must be formatted as a web address.
-
An email address.
-
A static file on your computer.
-
A current email field value. This means the data in the data object must be formatted as an email address.
Enter the hyperlink information, such as the web address or the location on your computer, in the Hyperlink Information section.
Click OK when you are finished.
Lock a Data Object
There's not a doubt that you're going to put time and effort into positioning and formatting your data fields. Once you're finished formatting a data field, you don't want to accidentally move or change the formatting of that field. It can be easy enough to do, especially if you're working in Preview, but it can cost you a lot of time.
For that reason, it's helpful to lock your data fields into position and lock the formatting so it can't be changed.
You can do so by selecting the data field, then going to the Formatting toolbar.
Click the Lock Formatting button to lock formatting.

Click the Lock Size/Position to lock the size and position of the data field.

Changing the Background Color of a Section
To further customize the look of your report, you can change the background color of each section, such as the Report Header section, the Page Header section, et cetera.
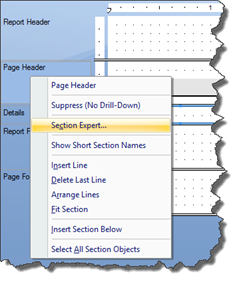
To set the background color of a section, go to Design view.
Click to select a section (in the blue area).
Right click, then select Section Expert.
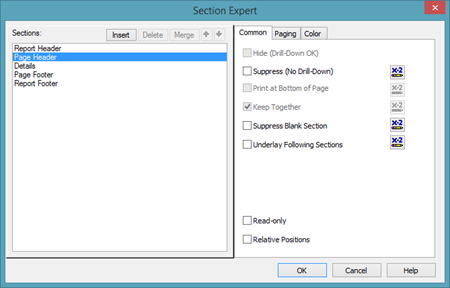
You will then see the Section Expert dialogue box.
Click the Color tab.
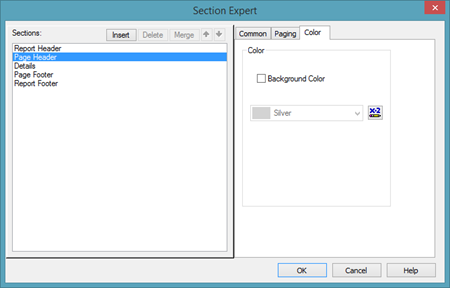
Put a check beside "Background Color."
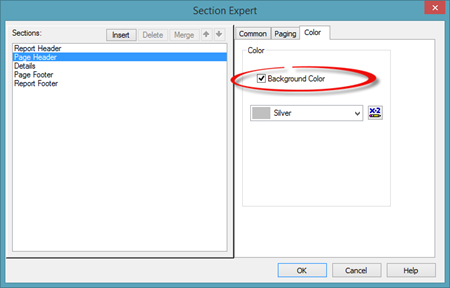
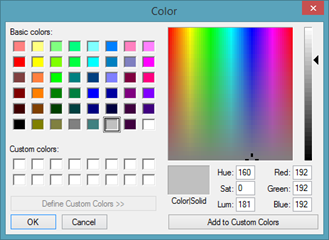
You can then choose a color to add as the background color of that section.
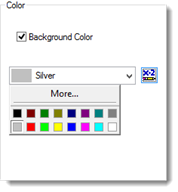
You can pick one of the colors that is displayed, or click More to see the Color Picker where you can create a custom color.