A budget is a plan for income and expenditures. It can give you an idea of how your financial situation should play out over a course of time. It can also help you set goals and see why you have met them, exceeded them, or failed to achieve them.
Every business should create a budget so that they can estimate how much money they will have after a given amount of time. Without a budget, you may be in for unpleasant surprises when it comes time to report on your financial performance. With QuickBooks Online, you can create budgets and then run reports to compare how your estimates matched up with your actual sales and expenses.
In this article, we will start by learning how to create a budget. You will see that you need to be subscribed to a certain level and have the right privileges. You'll then see how you can run various reports on your budgets to see how you are performing compared to your budgeting.
Creating a Budget
To start, you need to have the correct subscription level, which is Advanced or Plus. If you don't have this subscription level, you can upgrade. To upgrade, click the gear-shaped Settings icon in the Header, then go to Account and Settings under the Your Company heading. Find the Usage tab and scroll to the bottom where you will see an Upgrade Now button.
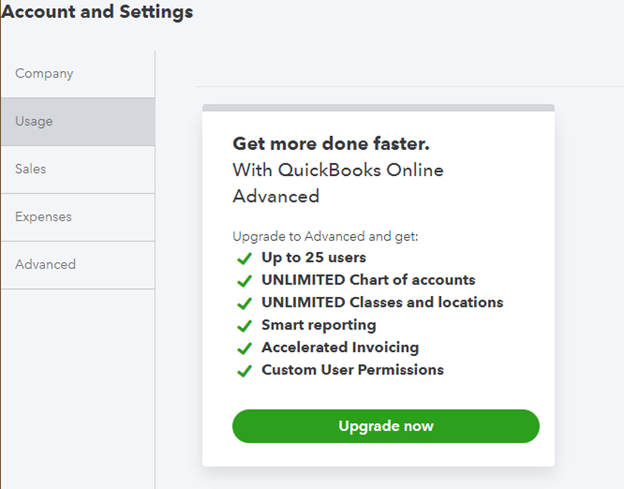
[Figure: Upgrading to the right subscription level]
In addition to having the correct subscription level, you will also need to be logged in as an administrator. You can check your user status by going to the gear-shaped Settings icon and clicking on Manage Users. There you can see administrators and add a new user if necessary.
Making a budget can be done at any time, but the best time to do it is at the beginning of your fiscal year. You can check your first month of the year by clicking on the gear-shaped Settings icon in the Header and going to Account and Settings under the Your Company heading.
In the Advanced tab, go to the Accounting section, which is at the top. Check the month that you have for First Month of the Fiscal Year. If you need to change the date, you can click the pencil-shaped Edit icon.
Preparing for Your Budget
When making a budget, you will want to view your data from previous years to set realistic expectations for your coming budget. You can get the data from the Reports menu. Find the Profit and Loss Detail report by typing it into the search bar.
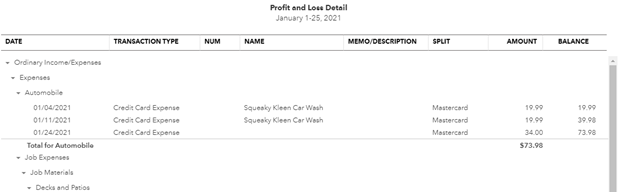
[Figure: Profit and Loss Detail report]
In the Profit and Loss Detail report, you can customize it to only show last year's data. To do so, from the Report Period dropdown, select Last Year. Then, click the Run Report button to see your report.
You can also choose to use data from the current fiscal year by selecting This Year-to-Date from the dropdown. Once you have your dates selected, click on the Run Report button again. This report can be used to get a good idea of what your upcoming budget should look like.
Adding a Budget
To add your first budget, click on the gear-shaped Settings icon in the Header and then click Budgeting in the Tools header. You will be taken to a wizard that will help you with setting up the budget.
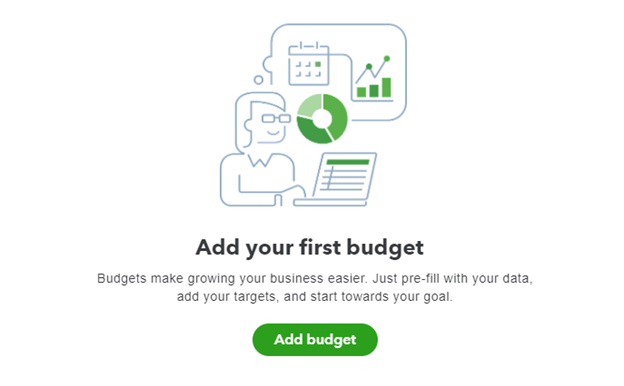
[Figure: Wizard for adding a budget]
Click on the green Add Budget button to get started. You will be taken to a screen with a spreadsheet where you can begin filling in your budget. You should start by giving it a descriptive name.
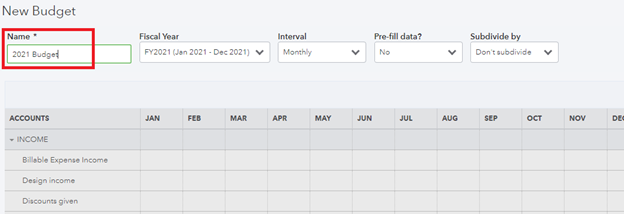
[Figure: Starting a new budget]
The next fields will ask for some more details about your budget, including setting the fiscal year and setting the interval such as monthly, quarterly, or yearly. You'll also have the option of pre-filling data with the previous fiscal year and also subdividing by customer. Click the Next button when you are ready to go on.
If you don't pre-fill the data, then you will be prompted on the next screen to fill in numbers in all the cells. If you did pre-fill the data, you will already have values in the cells.
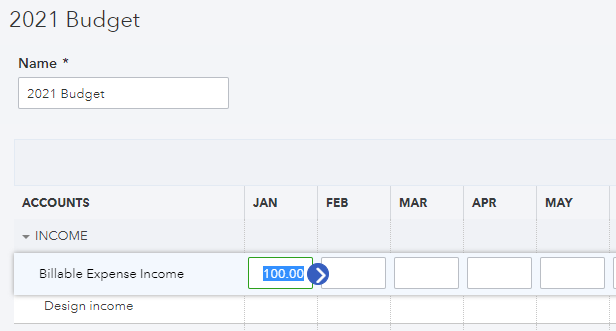
[Figure: Filling in the budget]
Pre-filling in the data will give you realistic expectations about your budget because it will be based on the previous year. That way, you can make slight adjustments to try and improve your financial situation by the end of the year.
If you are starting a new company and don't have anything to fill in, then you could begin by closing the dropdown arrows next to the income, other income, cost of goods sold, expenses, and other expense rows. That way, you can see that the budget is divided into those categories.
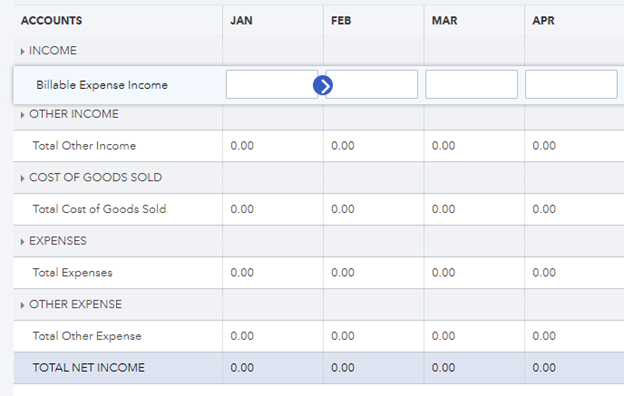
[Figure: Main categories of a budget]
You can then start with income at the top. Click on the dropdown arrow again to expand all the income rows. For this example, let's say that you plan to sell $5,000 worth of fountains and garden lights each month. You can then enter $5,000 starting in January.
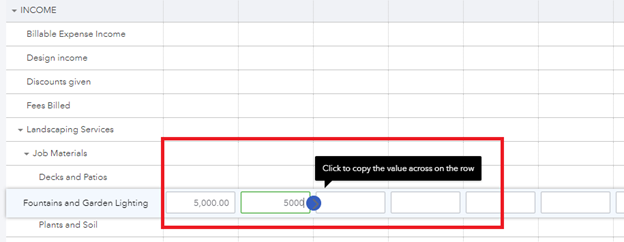
[Figure: Entering some income into the budget]
You will be able to save time by clicking the blue arrow that appears when you enter a value. That will copy the same amount to the rest of the cells in the row. You will then see that your total profit will be reflected by adding up this amount for each month.
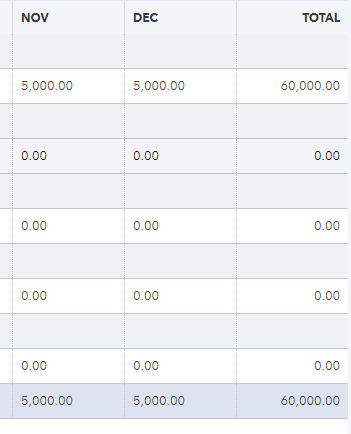
[Figure: Adding up the income affects the total profit]
Once you fill in all your expected income, you can then expand the Other Income category. Adding more income here will further increase your totals. For this example, we will make a total income of around $1,100,000 once we have added in all forms of income.
Once you have your income added, you will need to start entering your expenses. A good goal to have is to profit 10% of your total income. So, if you make $1,100,000 in income, then a profit of $100,000 would be ideal. That means you should try to limit your expenses to around $1,000,000.
The budget lets you see that to achieve this, you need a profit of around $9,200 each month.

[Figure: Using a budget to see how much you need in profit each month to reach your goal]
By planning out your budget, you can see how it is easy to know if you are on schedule to meeting your financial goals or not.
You don't have to just set month-to-month goals. You can adjust the view with the gear-shaped icon above the table. This allows you to condense the view of the budget by making the columns by quarter or year instead of just month. You can also hide blank rows and make the table more compact.
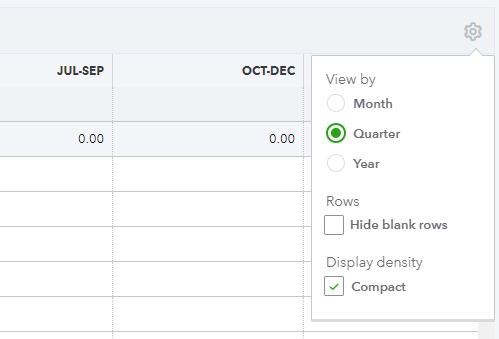
[Figure: Changing the view of the budget table]
Once you have finished filling in your budget, click on the Save and Close button at the bottom. You will now see your budget appear on the Budgets page.
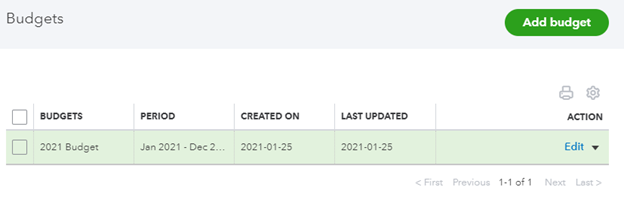
[Figure: Available budgets]
You can see your budget's name, period it covers, when it was created, and when it was last updated. The Action column gives you several functions to perform. From the Action column, you can edit, copy, delete, run a Budgets vs. Actuals report, or run a Budget Overview report.
Editing a Budget
To make changes to a budget, click on the Edit button in the Action column. The budget will open up in its own pane where you can make any changes you need to it, just as you did when creating it. You can also change the budget's name from this window.
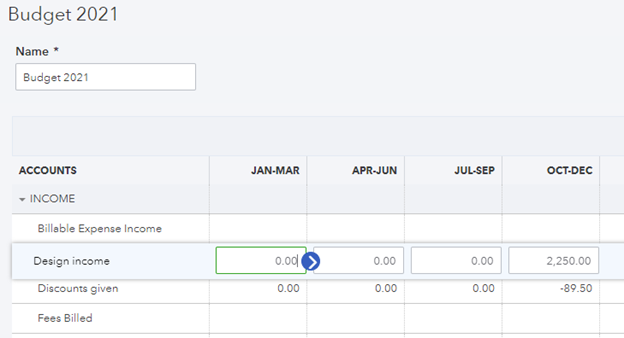
[Figure: Editing a budget]
After making your edits, click the Save and Close button at the bottom right.
Copying a Budget
You can make a copy of a budget just by clicking on the dropdown arrow in the Action column and choosing Copy. This will open up a new Budget window that is pre-filled with the data from the budget you selected.
[Figure: Copying a budget]
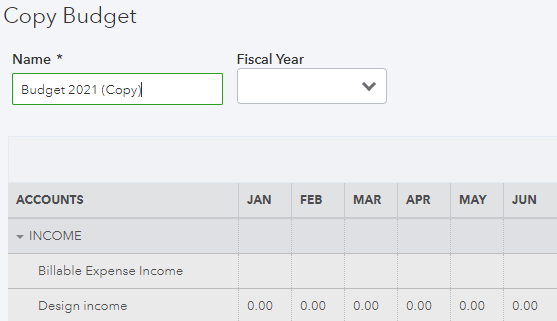
Change the name of the budget and set the Fiscal Year. Click the Create Budget button at the bottom right of the screen. You can then make any changes to the cells of the table before clicking the Save and Close button at the bottom right.
Deleting a Budget
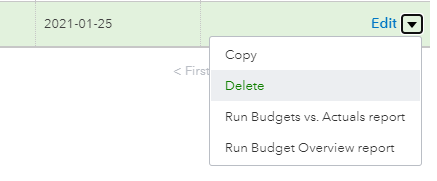
To remove a budget, click on the dropdown arrow in the Action columns of the budget that you want to delete. From there, click on Delete. A warning message will pop up to confirm if you actually want to delete it. Click on the Yes button to confirm deletion.
Running a Budgets vs. Actuals Report
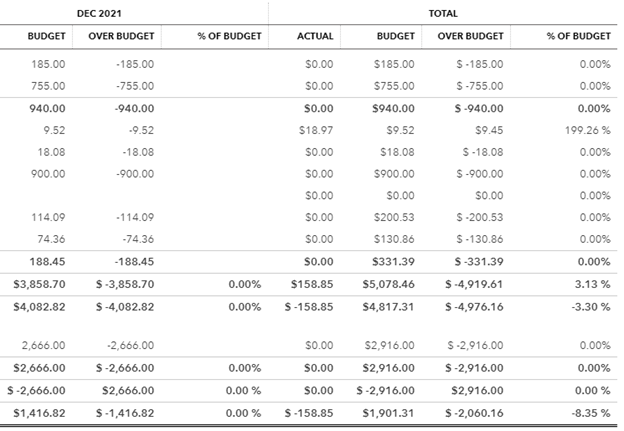
The Budgets vs. Actuals report shows your actual income and expenses compared to your budgeted amounts. You can run this directly from the budget in the Budget window. Click the dropdown arrow in the Action column and select Run Budgets vs. Actuals Report.
Wait for the report to load. You will then see a full report showing your actual and budgeted amounts for each month, along with the total for the year.
[Figure: Budgets vs Actuals report]
You can customize this report in a lot of different ways. Click the Customize button above the table to open up the Customize Report pane.
From here you can make general customizations, such as selecting the budget, reporting period, accounting method (cash or accrual), number format (divide by 1000 or without cents), and showing negative numbers in red.
You can also make adjustments to the rows and columns. You can choose for the grid to show months, quarters, or years. You can choose to show only accounts that had budgeted amounts. You can also choose whether to show non-zero or active rows and columns only. For period comparison, you can show columns for dollars over budget, percent over budget, dollars remaining, and percent remaining.
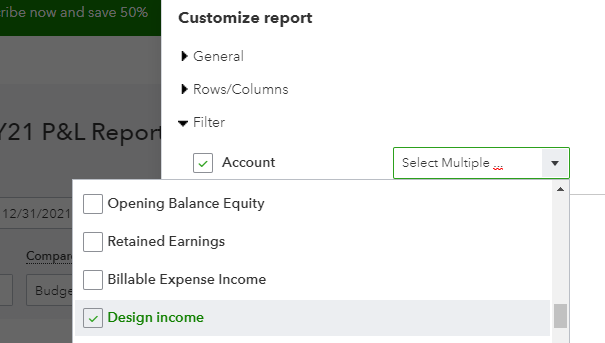
Next, you can filter by account. By default, it shows all accounts. Select the dropdown arrow and then check the accounts that you want to show to filter out all others.
[Figure: Customizing the account in the Budgets vs Actuals report]
Lastly you can change information in the header and footer of the account. You can edit the information in each part, or toggle whether each part is viewable.
In the header, you can change the company name, report title, and whether or not to show the report period. In the footer, you can choose whether or not to show the date prepared, time prepared, and report basis. Lastly, you decide if the header and footer should be aligned to the center, left, or right.
Once you have decided on your options, click on the Run Report button at the bottom right.
[Figure: Budgets vs. Actuals with customized account]
You can also view a report that is subdivided by customers. You first need to create a budget that is subdivided by customers. At the Budget page, click on the New Budget button. In the New Budget panel that pops up, click on the dropdown arrow in the Subdivide By field and select Customer. In the Add Subdivided Budget For field, select all. You can also choose to pre-fill data and change the interval.
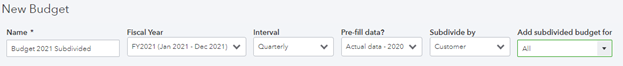
[Figure: Adding a budget that is subdivided by customers]
Click the Create Budget button at the bottom right to start creating the budget. It will take extra time to make a subdivided budget, and you may see a screen telling you to wait.
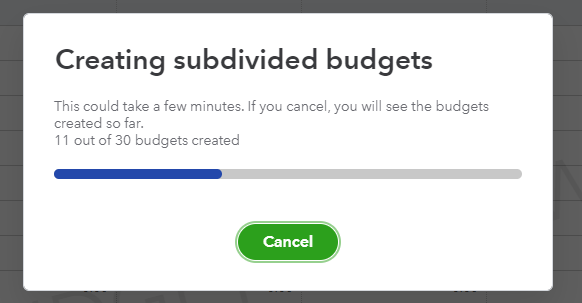
[Figure: Processing a subdivided budget]
You will then be in a panel where you can enter the budget data into your budget. You will then be able to cycle between the customers you want to make budgets for by clicking on the View Budget For field.
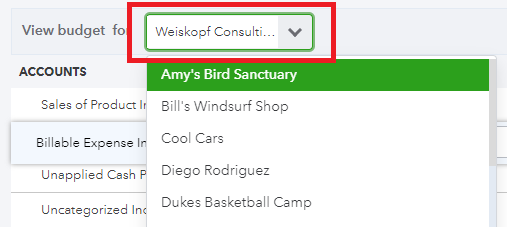
[Figure: Entering budgets for customers]
Click on the Save button at the bottom right before moving on to another customer. When you are completely finished, click on the Save and Close button at the bottom right.
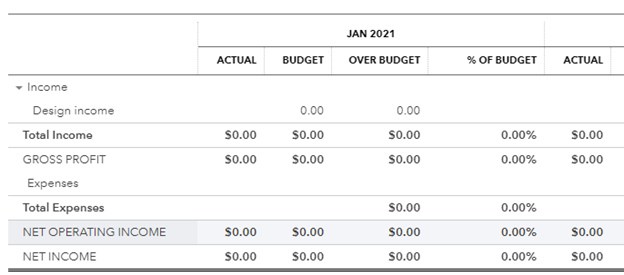
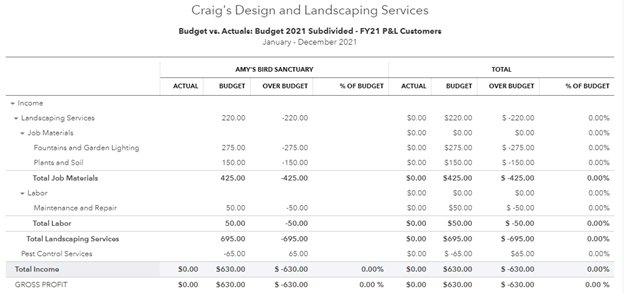
Now, when you click on the Run Budgets vs. Actuals Report link in the Action column, you will generate a report subdivided by each customer.
[Figure: Budgets vs. Actuals report subdivided by customers.]
This time, when you want to customize the report, you will see a few more options. Click the Customize button above the table.
In the rows/columns category, you can choose whether or not to show accounts vs. customer, customers vs. months, customers vs. quarters, and customers vs. total.
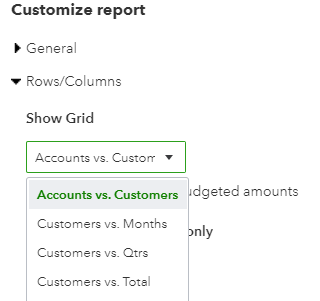
[Figure: Customize the rows and columns to display in a Budgets vs. Actuals report]
You can also filter out by customer in the same way that you filtered out by account. Click on the Customer dropdown and select the checkboxes next to each customer that you want to see in the report.
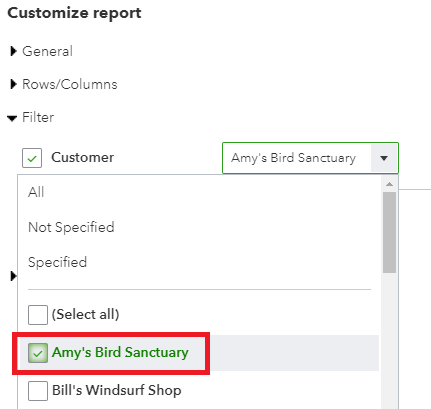
[Figure: Filtering by customer in the Budgets vs Actuals report]
You may now click the Run Report button at the bottom right of the screen to see the new report.
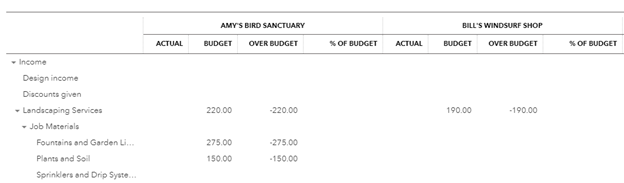
[Figure: Showing a customized Budget vs. Actuals report that's subdivided by customers]
You will now see only the information that you specified in the customization menu. Now that you have a customized report, you can save this customization in order to quickly view the report with these parameters again.
To save the customization, click on the Save Customization button next to the Customize button. You can then name your file. If needed, you can organize it into a group and also share the format (not financial data) with others in the QuickBooks Online community.
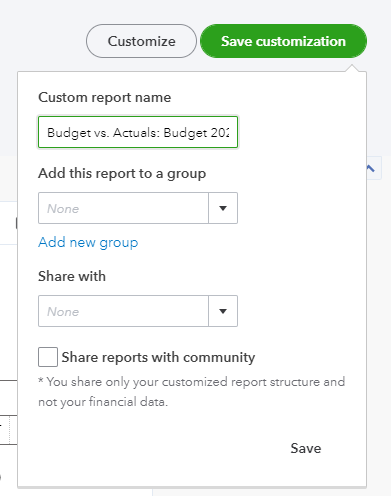
[Figure: Saving a customization format]
Click the Save link at the bottom to finish saving the customization. The next time that you want to view this report, go to the Reports page from the left-side Navigation Pane. Then, click on the Custom Reports tab to load this report again.
With your finished report, there are a few ways that you can share it with people that need to view it. Above the table are icons for emailing, printing, saving as PDF or Excel.

[Figure: Options to save or share the report]
Running a Budget Overview Report.
Another type of report that you will want to run that relates to budgets is the Budgeting Overview report. This report gives an overview of the budgeted amounts for the budget. To run this report, click on the dropdown icon in the Action column for the selected budget and then click on the Run Budget Overview Report link.
You will then see an overview of the budget. You can customize the report in the same way that you customized the Budget vs. Actuals report. To change the columns from months to quarters, click on the Customize button above the table. In the Rows/Columns section, click on the Show Grid field and change it to Accounts vs. Quarters. Click on the Run Report button to see the changes.
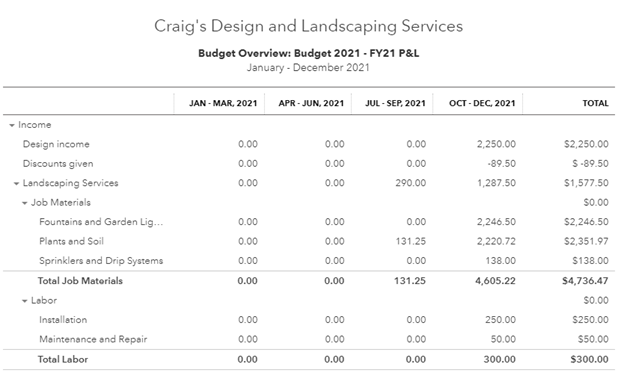
[Figure: Customizing a Budget Overview report]
Just like with the Budget vs. Actuals report, you can also run this report subdivided by customers. You can go back to the Budgets page and run the report from the link there, but there is another way to do that from this Report page.
At the top of the page, find the Budget field and click on the dropdown arrow to find your budget that has already been subdivided.
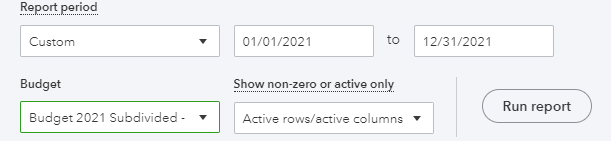
[Figure: Creating a Budget Summary report with a budget subdivided by customers]
Once it has been selected, click on the Run Report button to generate the new report. You can filter out customers using the Customize button just as you did with the Budget vs. Actuals report.
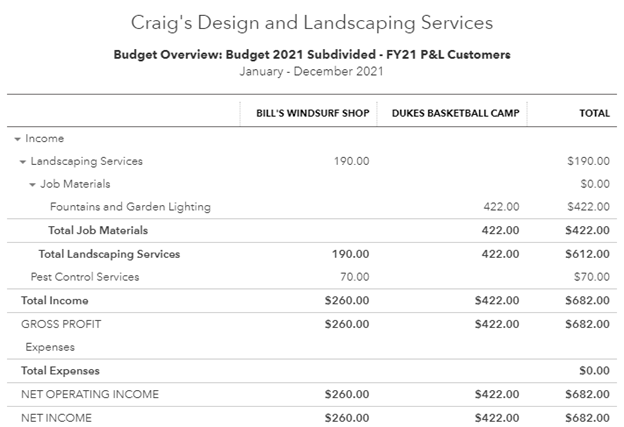
[Figure: A Budget Overview report subdivided by customers]
You can also save your customization as shown before, in addition to emailing, printing, or exporting the report to PDF or Excel.
Accessing Reports through the Reports Page
You have already seen how to run the reports from the Budgets page. You can also access reports through the Reports page in the left-side Navigation Pane.
On the Reports page, scroll down to the section on Business Overview. There, you can find both the Budget vs. Actuals report and Budget Overview report.
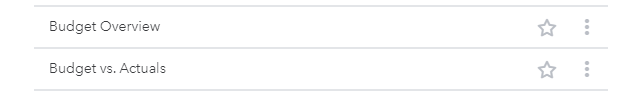 [Figure: Budget Overview and Budget vs. Actuals on the Reports page]
You can also get to these reports by typing "Budget" into the search bar in the top-right.
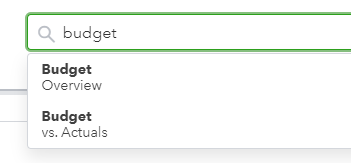
[Figure: Searching for the budget reports]
Clicking either of these will run the reports. You can change which budget to use from the Budget dropdown at the top of the page.
Conclusion
In this article, you learned all about creating budgets in QuickBooks Online. You learned that you need to be using the right subscription level and have the right privileges.
You saw how to create, edit, delete, and copy budgets. You also learned about setting goals while making a budget.
Lastly, you learned about running various reports related to budgets. You saw how you could customize them in various ways to suit your needs.