Inserting a Table
Just like in MS Word, you can insert tables into slides. Although the processes are very similar, we're going to cover it in depth here. If you're very familiar with MS Word, this entire article will be very easy for you.
To insert a table, go to Insert> Table. This dialogue box will appear:
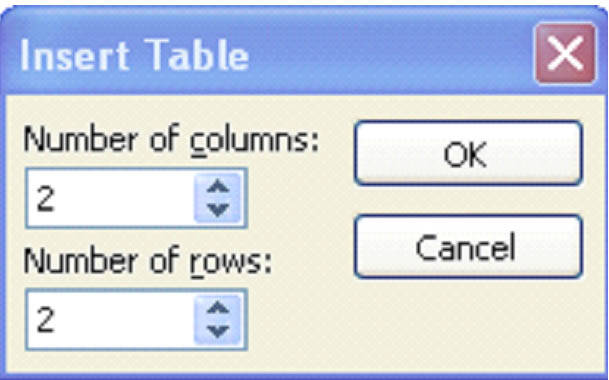
The default setting for MS PowerPoint 2003 is 2 columns and 2 rows. We'll leave it like that for this example. However, you can have as many columns and rows as you'll need.
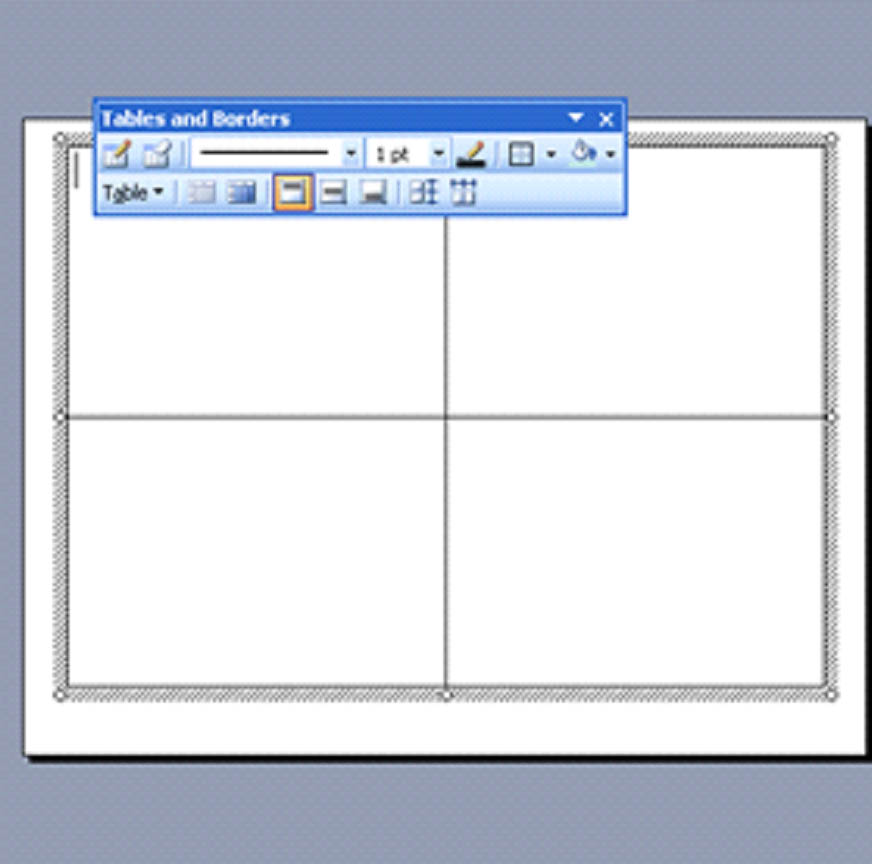
Click OK.
On your screen, you'll see your table appear along with the Tables and Borders floating toolbar.
Entering and Formatting Data in a Table
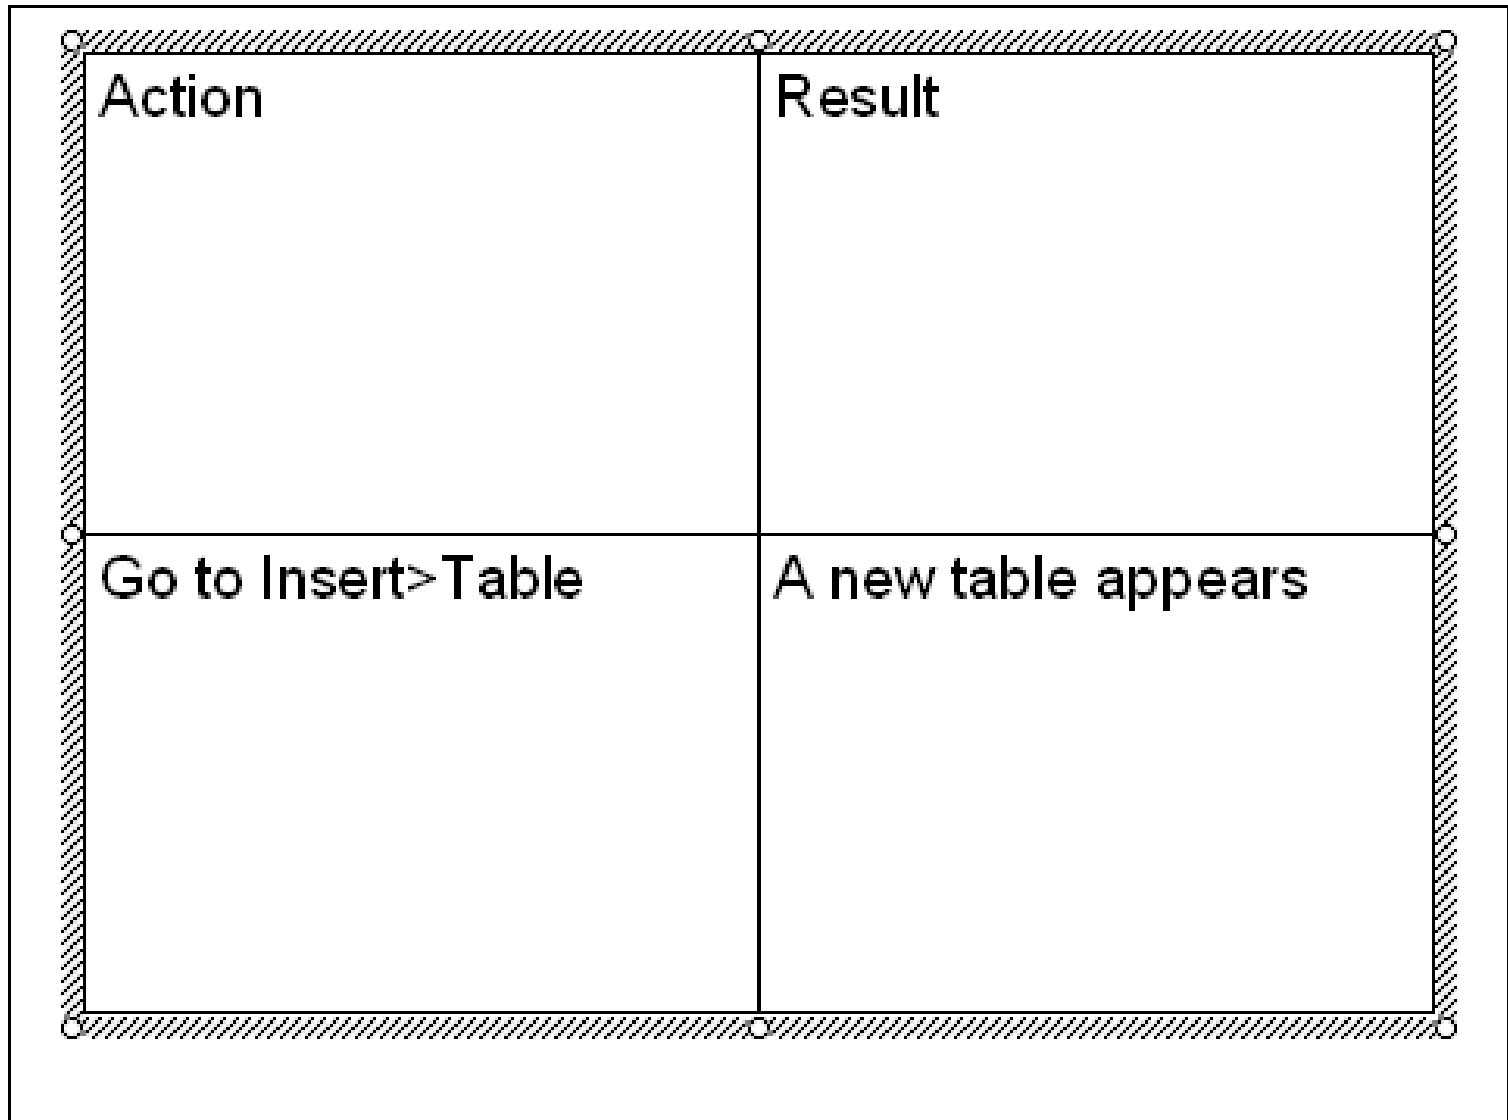
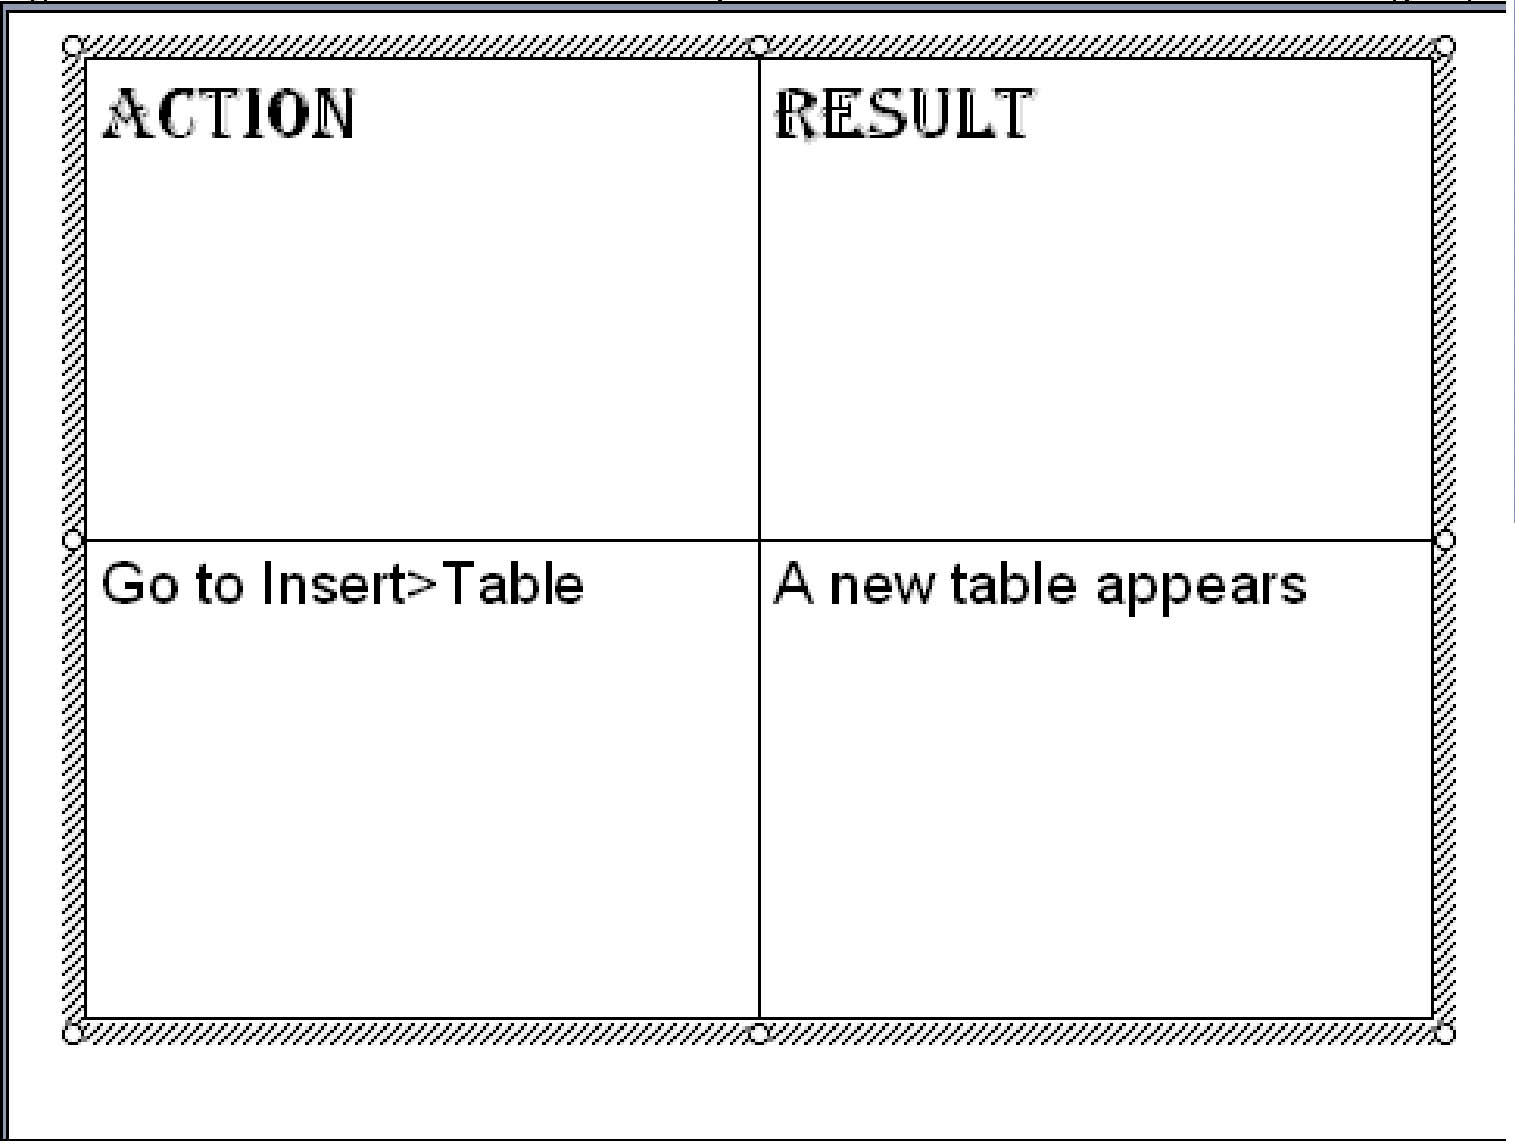
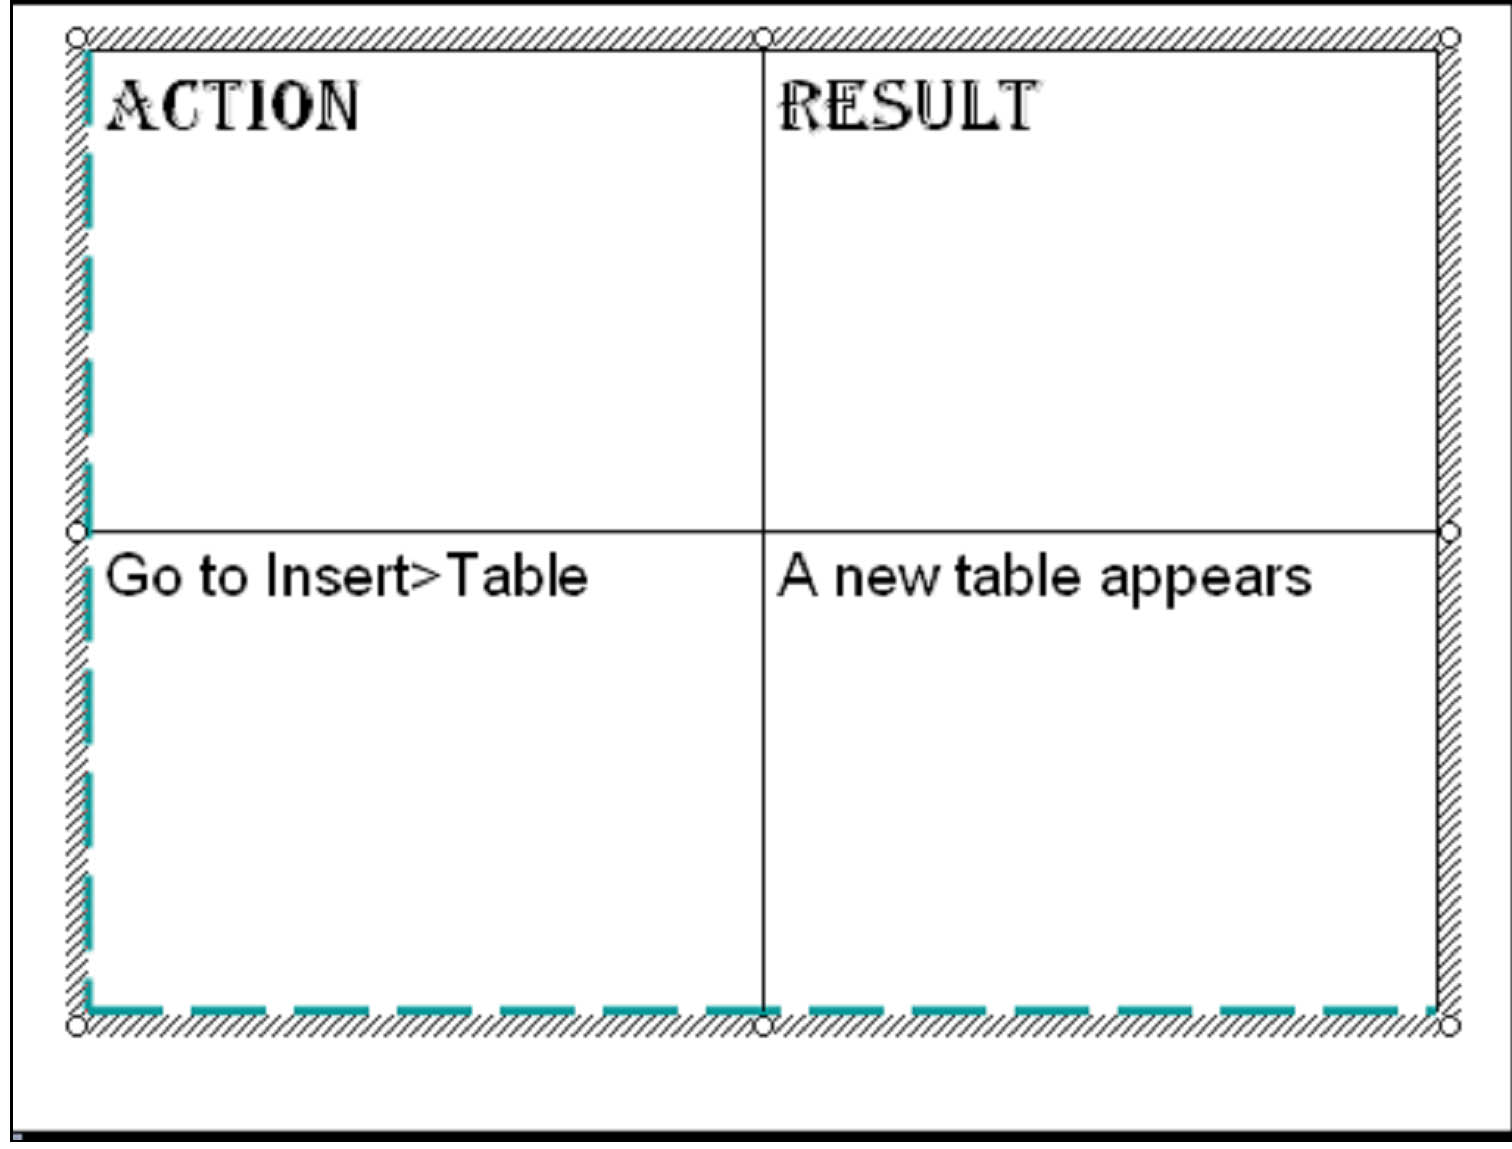
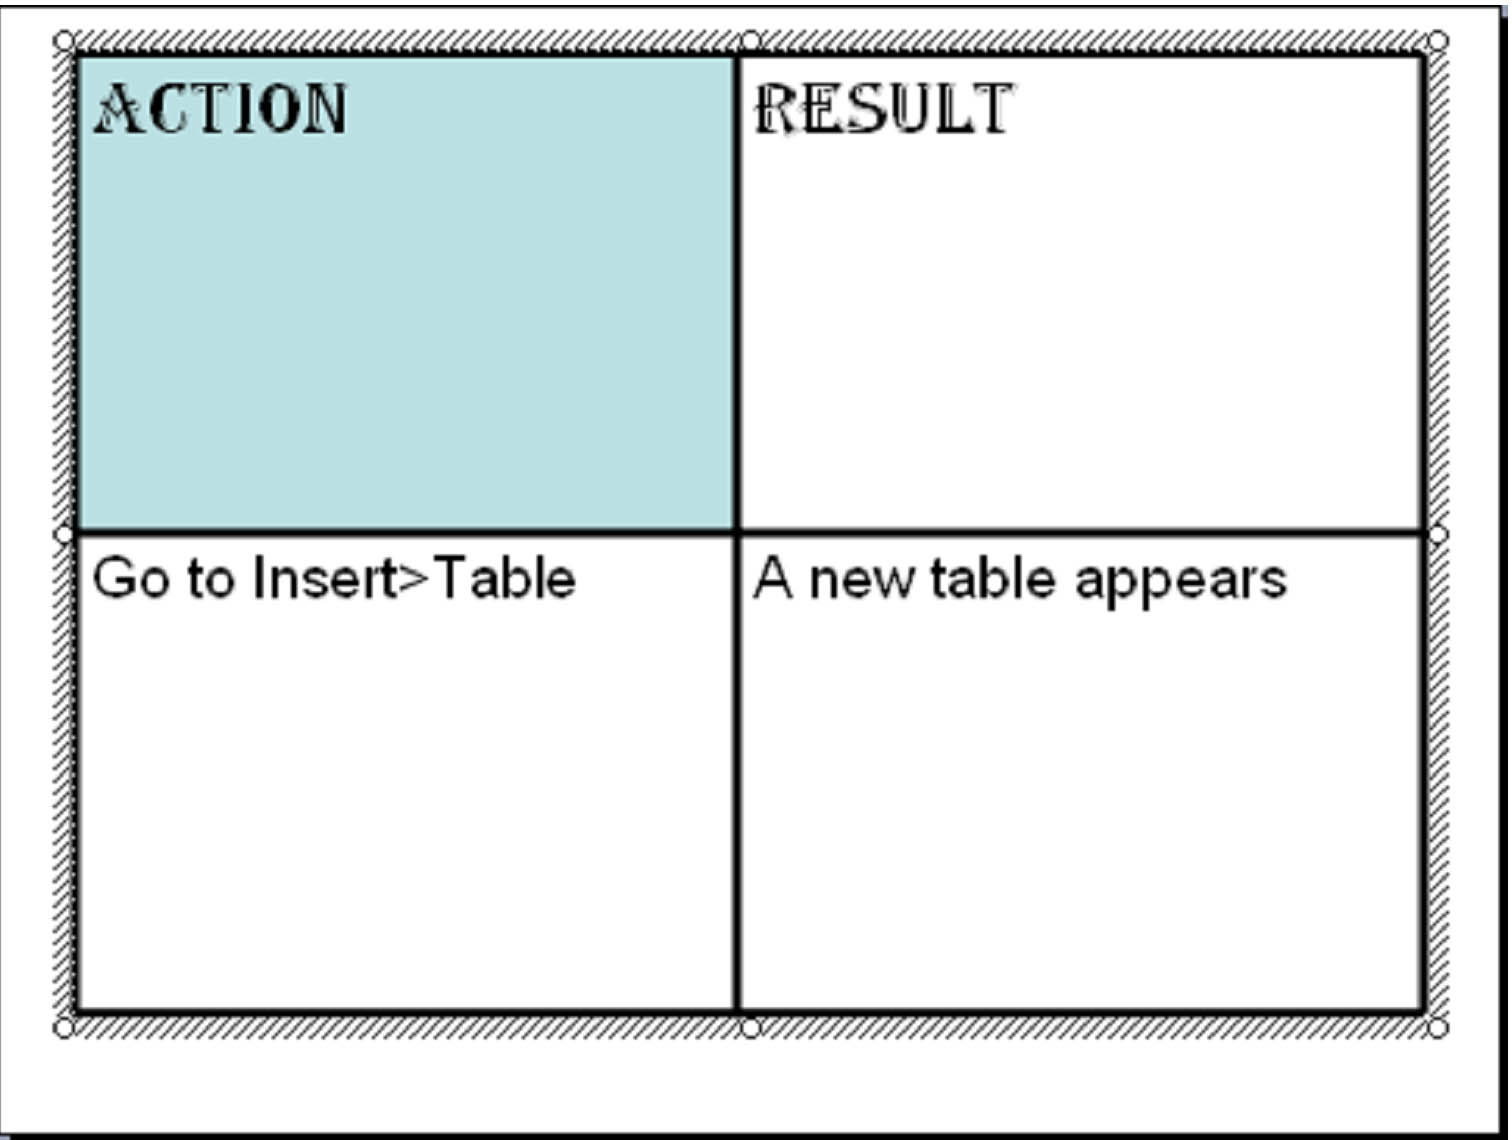
Once you've created the table, the cursor appears in the first column, in the first row. You can start entering text for your table. We've done so in the snapshot below.
You can format the text and/or data in the text box by using the Formatting menu, just as you would for slide text.
Let's change the text to a different font.
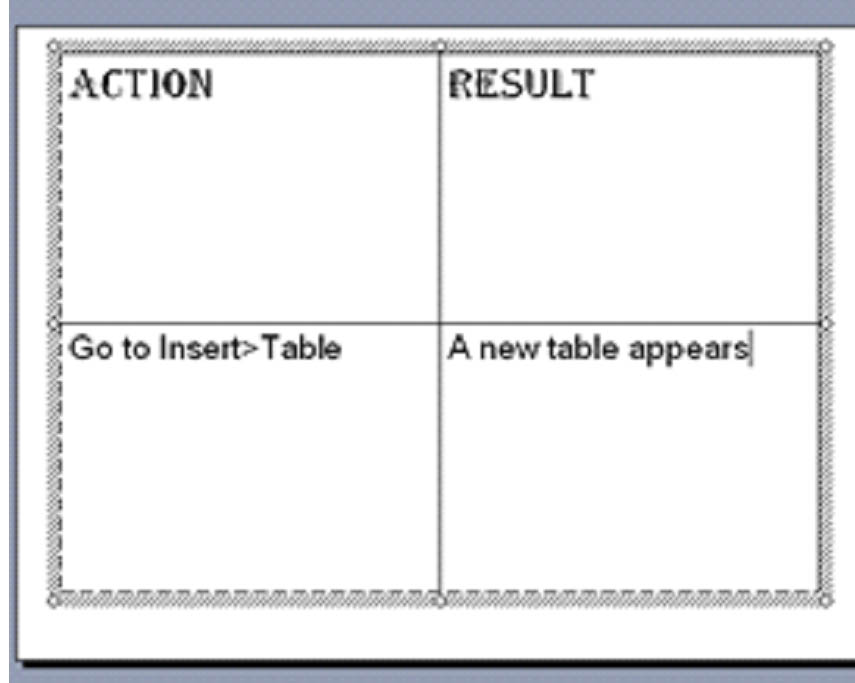
First, we select the text that we want to change. Let's change the column headings: Action and Result.
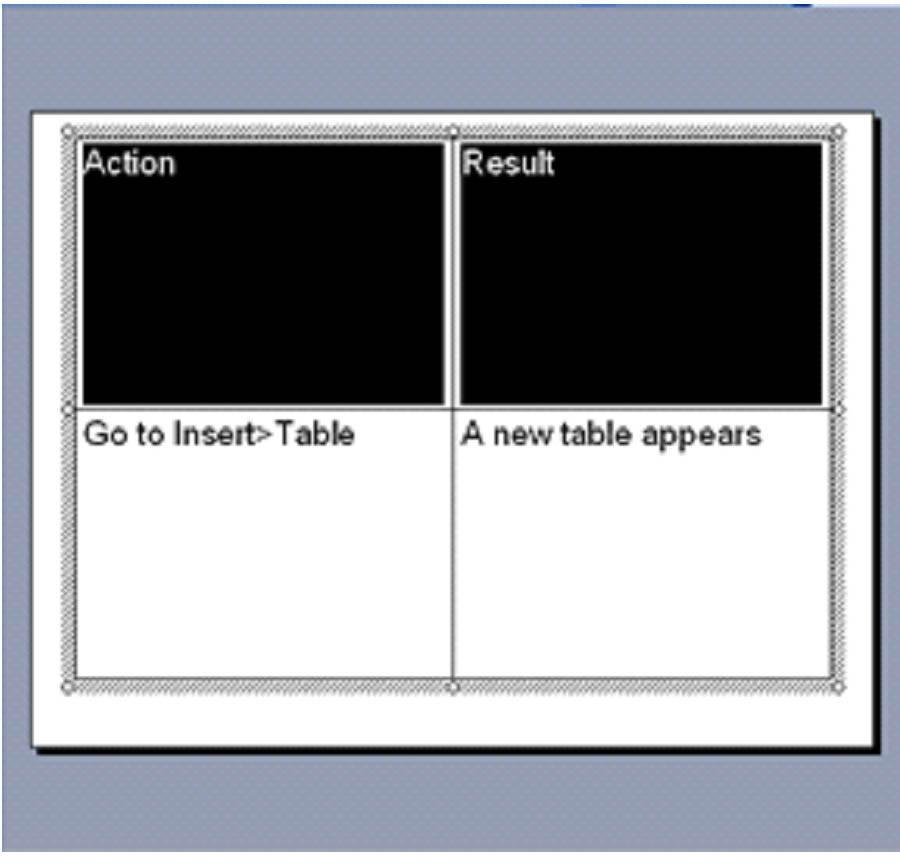
We're going to enlarge the font and change the type using the Formatting toolbar.
Our changes make the text look like this:
Formatting a Table
When we format a table, we can change the size, border, row size, column size, and add color to it. To format a table, you use the Tables and Borders toolbar pictured below.

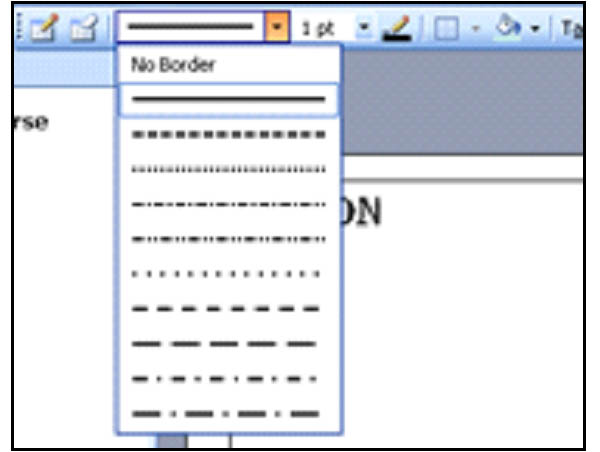
Let's say we want to change the border of the table. You'd go to the Border Style box 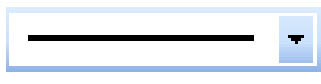 on the Tables and Border toolbar. A drop down menu appears when you click on the arrow. You can then select your border style.
Once you select a border, a pencil will replace your mouse cursor. Using your mouse, move the pencil to a line on your table, then click. That line will then have the border you've chosen.
Note: Each cell has its own lines; therefore, you must apply border to all sides of a cell.
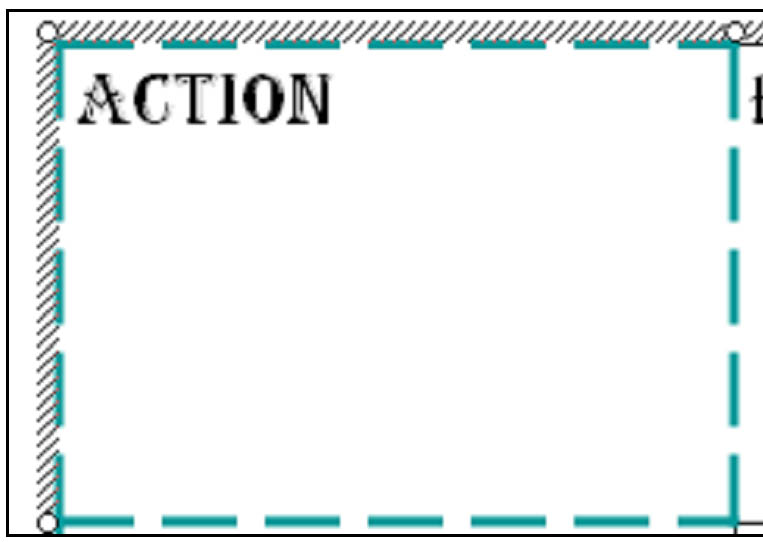
In the picture below, we've started to apply the dotted line border to the table. This gives you a good example.
We can also change the thickness of the border. Go to the Border Width box on the Tables and Border toolbar. You can increase it to get a thicker border or decrease it to get a thinner one.
We're going to increase the thickness of the border we've applied to 4 ½ points.
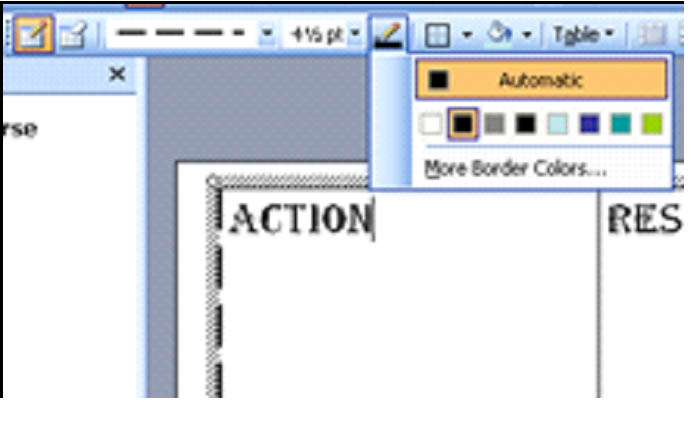
As well as changing the thickness, you can also change the color. Go to the Border Color  icon on the Tables and Borders toolbar. Select a color you want from the drop down menu.
We're going to choose green.
Use the pencil to click on border lines and change their color, as seen below.
You can also change where a border appears by using the All Borders icon . Using this can be quicker than using the pencil to click on every single line, especially in larger tables.
When you click on the All Borders icon, a drop down menu will appear as pictured below.
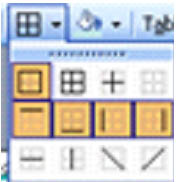
We're going to select the second border type on the first row. This will put border lines around the table and each cell. However, we could also choose just to put a border on one side, diagonally across, on top, or on bottom.
Note: Make sure you select the entire table or the appropriate cells before using the All Borders icon.
We selected one cell, as shown below.
Adding Color
You can also add color or colors to any table that you create in PowerPoint. Just select the cells that you want to add color to – or the entire table – then click the Fill icon  . Next, select the color.
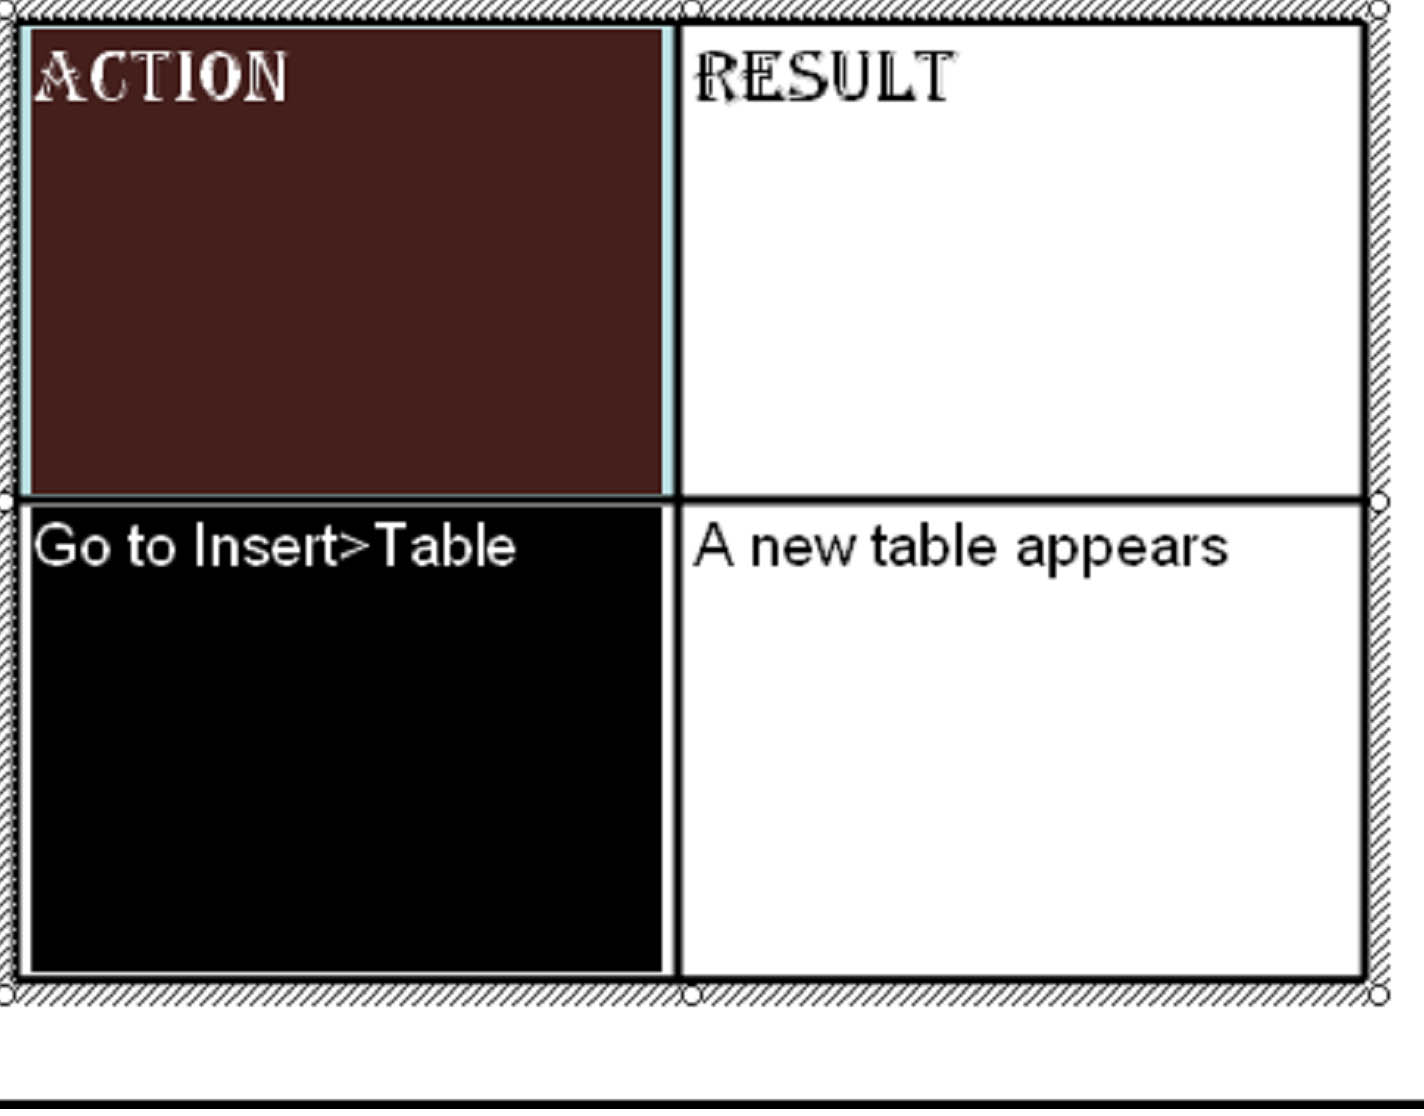
In the example below, we added a fill color to one cell.
Add More Columns or Rows
Let's say you've created a table, but you discover that you need to add columns or rows. With MS PowerPoint 2003, it's as easy as using the Tables and Borders toolbar.
Just click the Table button , then select where you want to add the new column or row.
Merge Rows and Columns
If you ever want to combine the contents of two cells or split one cell into two different cells, you can click the Merge Cells icon  or the Split Cells icon
  .
.
When you click Merge Cells, select the two cells you want to merge. Then click the Merge Cells icon. See the snapshots below.
Next, we click the Merge Cells icon and the two cells become one.
Click anywhere in the new cell to unselect the cells and save the changes.
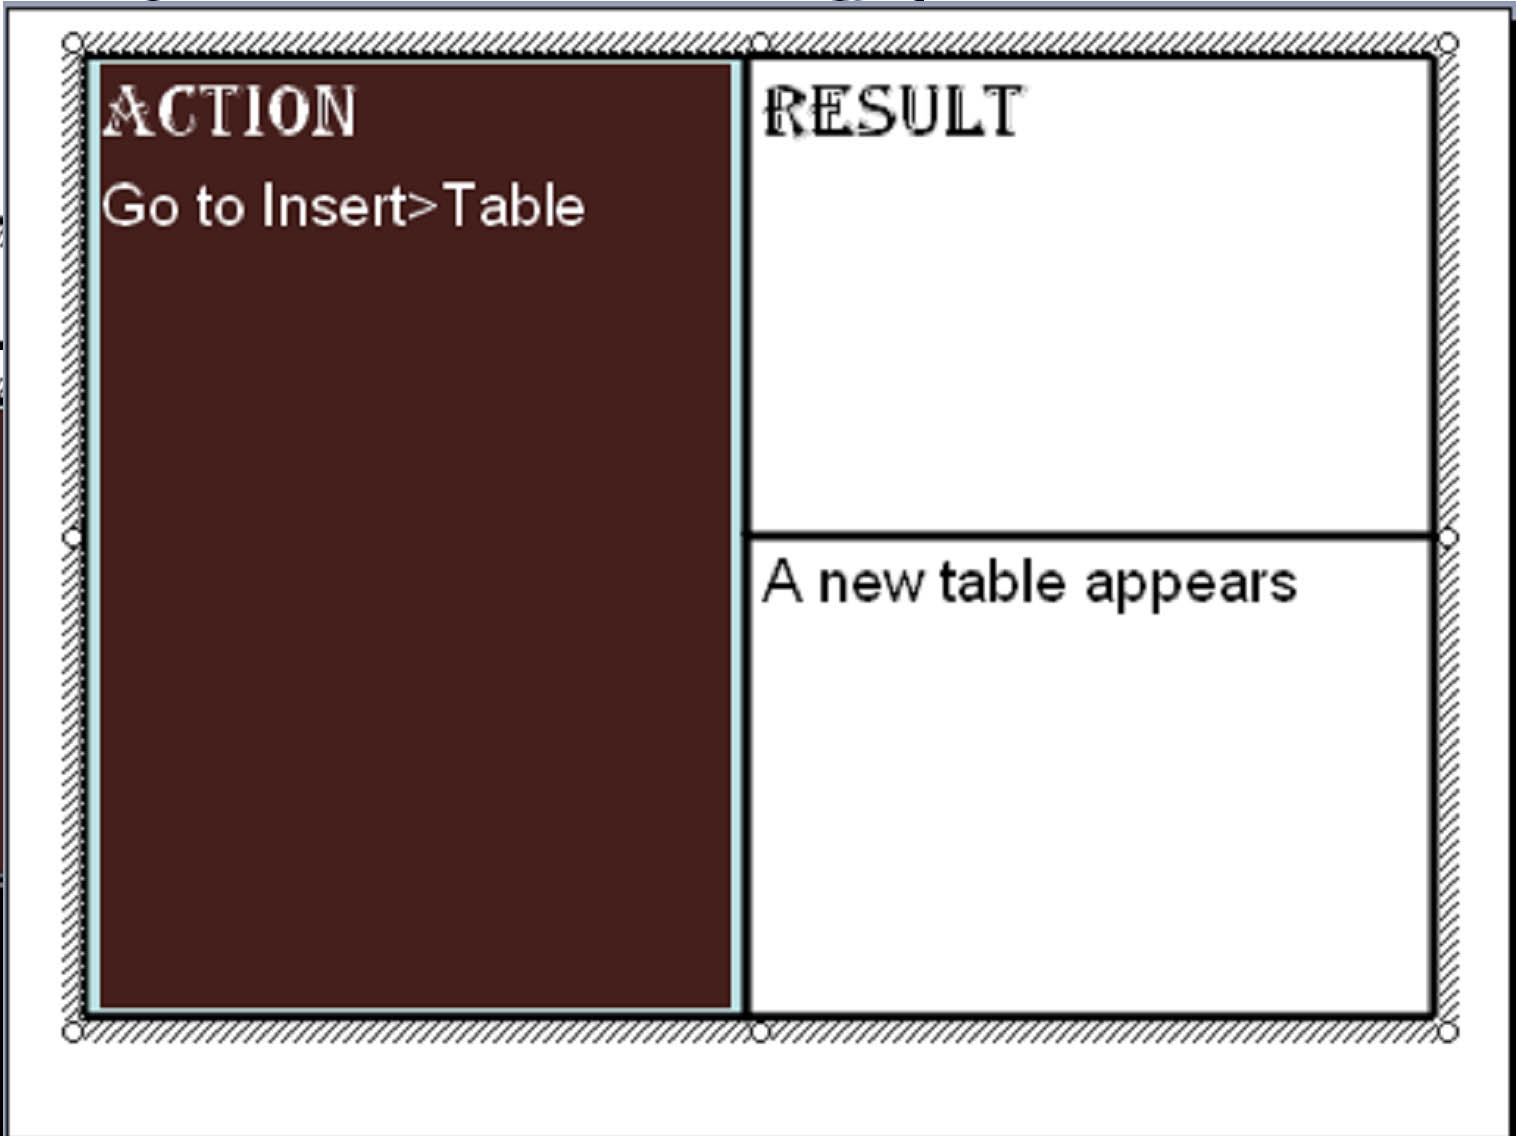
When you split a cell, select the cell that you want to split, then click the Split Cell icon. You can see in the picture below how the "Result" cell was divided into two cells.

Align Cell Contents
You can align the cell contents to either the top of the cell, the center of the cell, or the bottom of the cell using these three icons respectively.
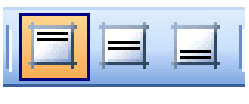
If you align contents to the top, the text will appear toward the top of the cell as illustrated in the snapshot above.
Content aligned to the center will appear in the middle of the cell.
Finally, content aligned to the bottom will appear at the bottom of the cell.
Column and Row Height
MS PowerPoint 2003 makes it easy to make sure your tables are neat and professional and that all rows and columns are the same size.
To make sure your rows are all the same height, select the rows and then click the Distribute Rows Evenly icon  on the Tables and Borders toolbar.
To make sure all your columns are the same width, select the columns. Then click the Distribute Columns Evenly  icon.
icon.
Insert a Word Table
A Word table is a new MS Word document that you insert into a slide as a table.
To insert a Word table:
Go to Insert> Object. Scroll down and select Microsoft Word Document.
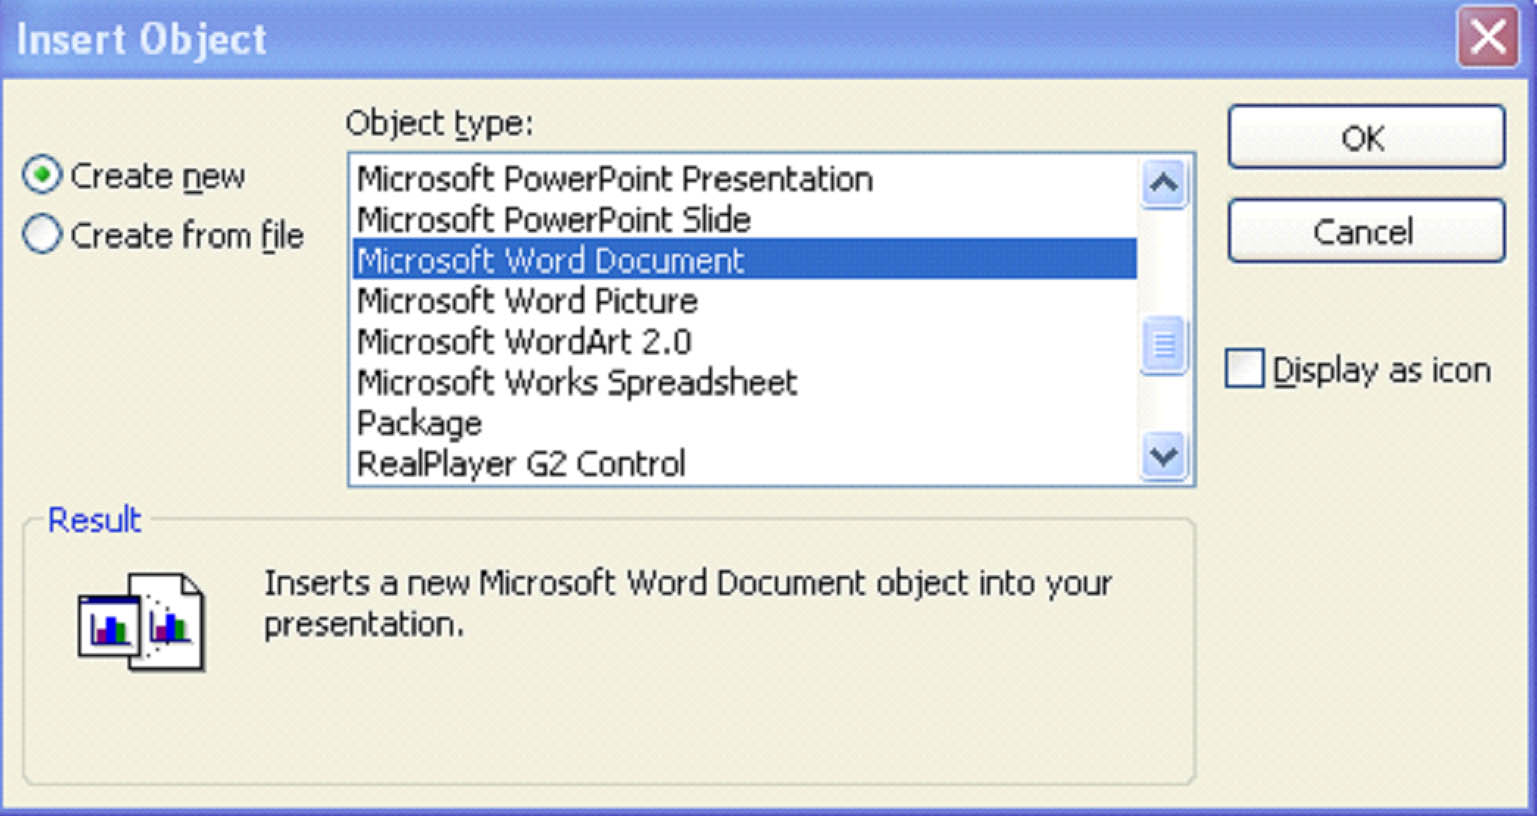
Click OK.
The new document will be inserted onto your slide.
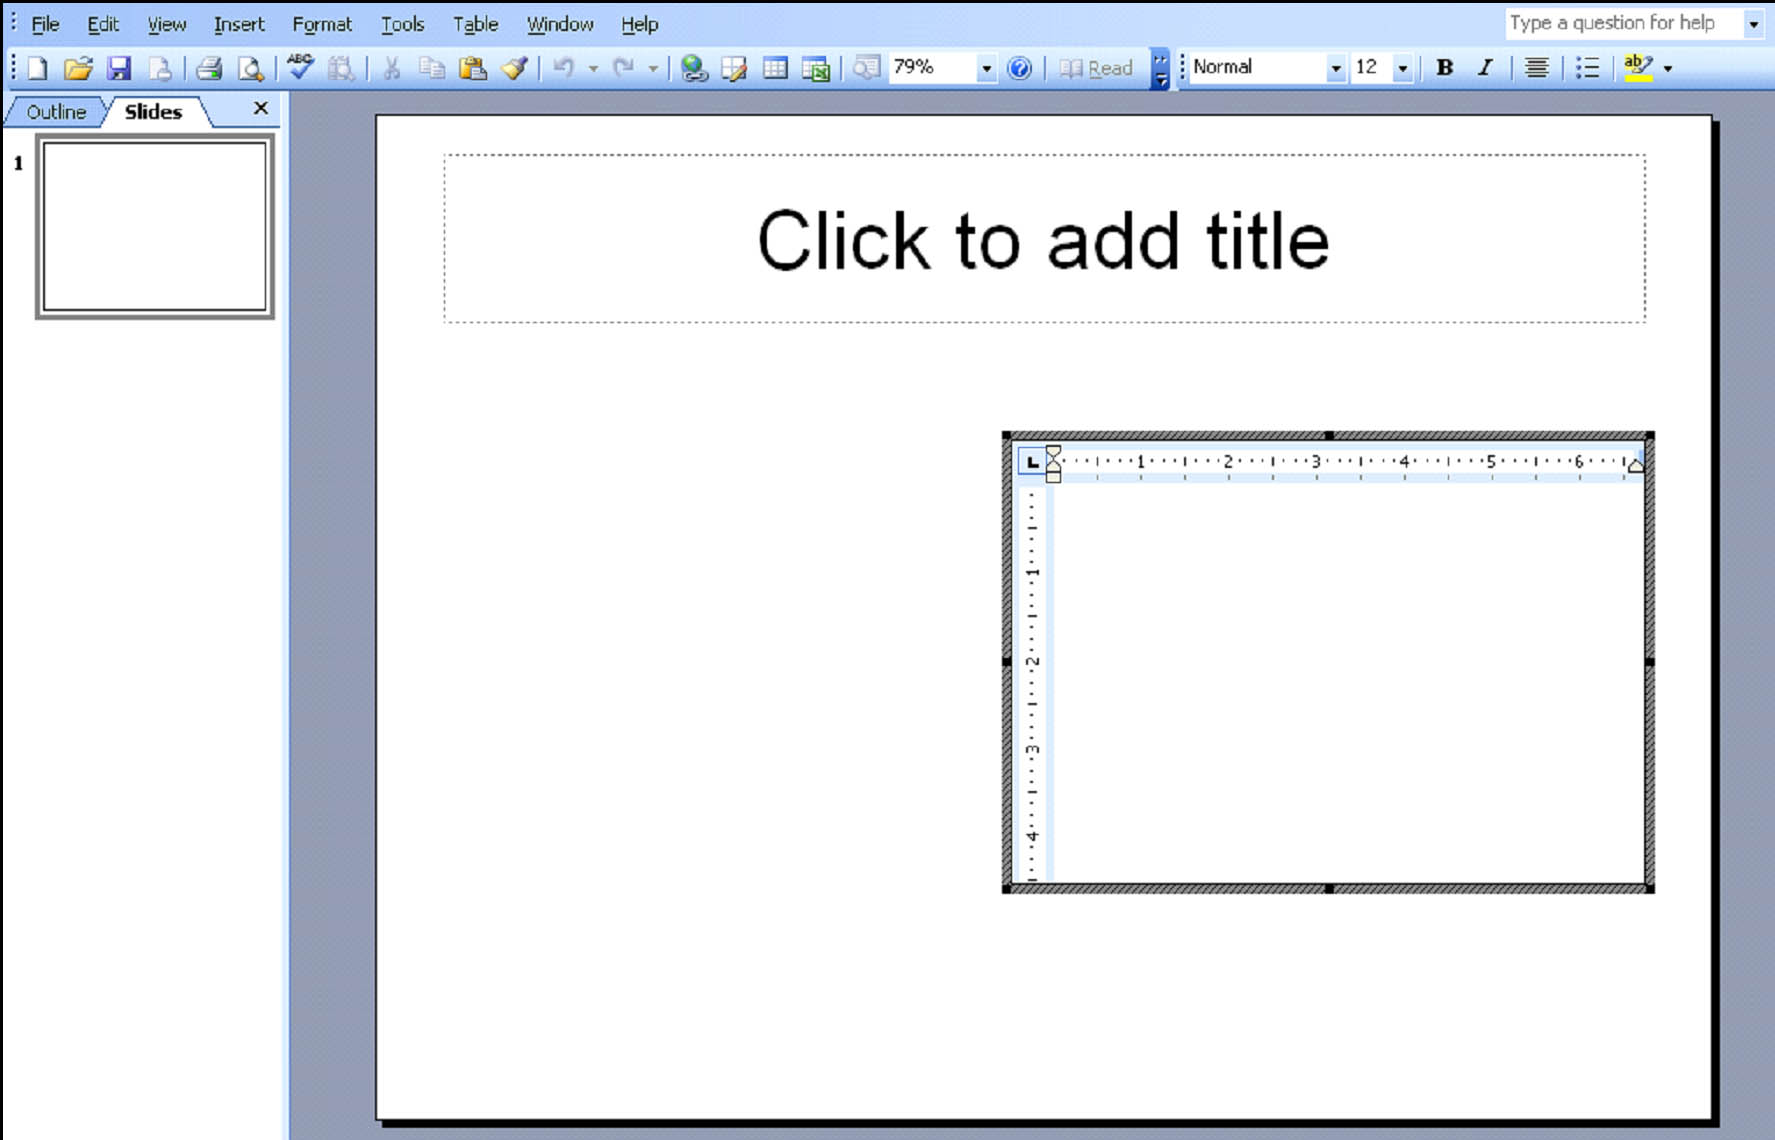
Note: Take a close look at the menu bar in the snapshot above. It is the menu bar for MS Word, not MS PowerPoint. As long as you are working in the Word table, you will have access to the MS Word menu bar. The reason for this is that MS Word offers a lot more features for creating and formatting data in tables.
Use the commands on the Table menu on the menu bar to create the table that you want.
Click outside the table when you're ready to return to PowerPoint.
Insert a Chart
To insert a chart onto a slide, go to Insert> Chart.
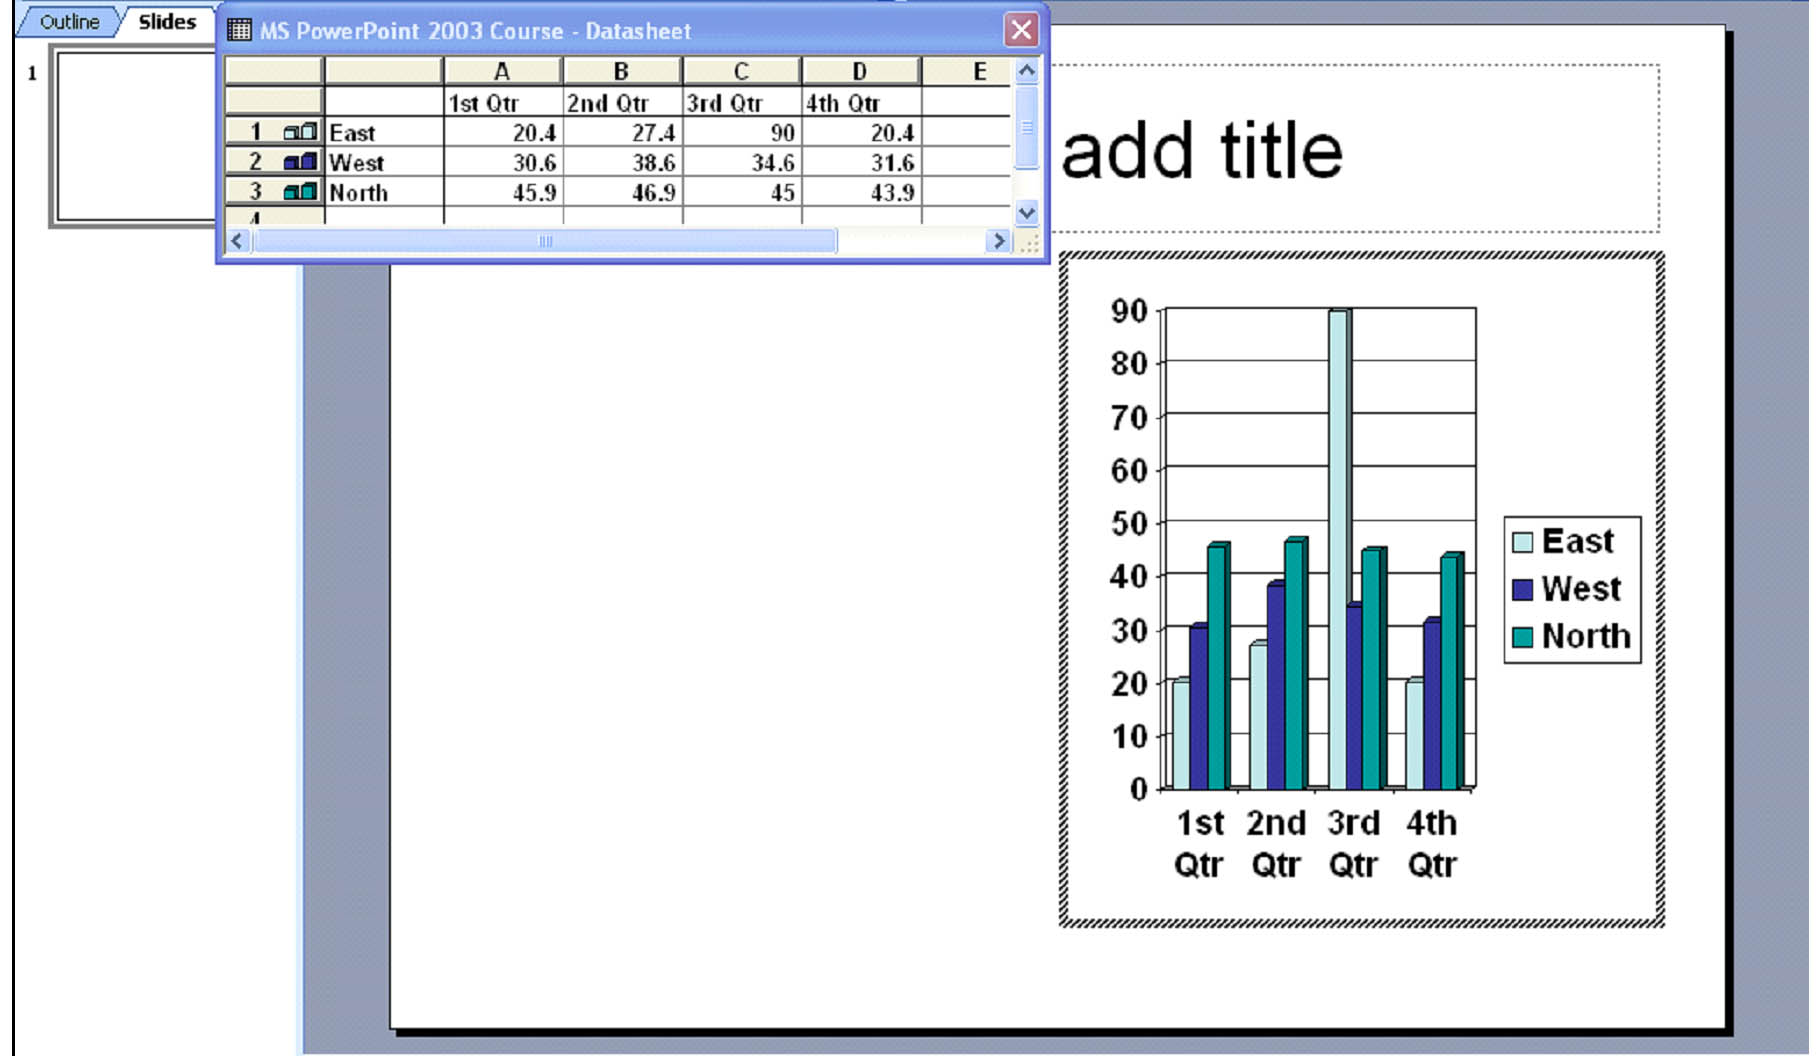
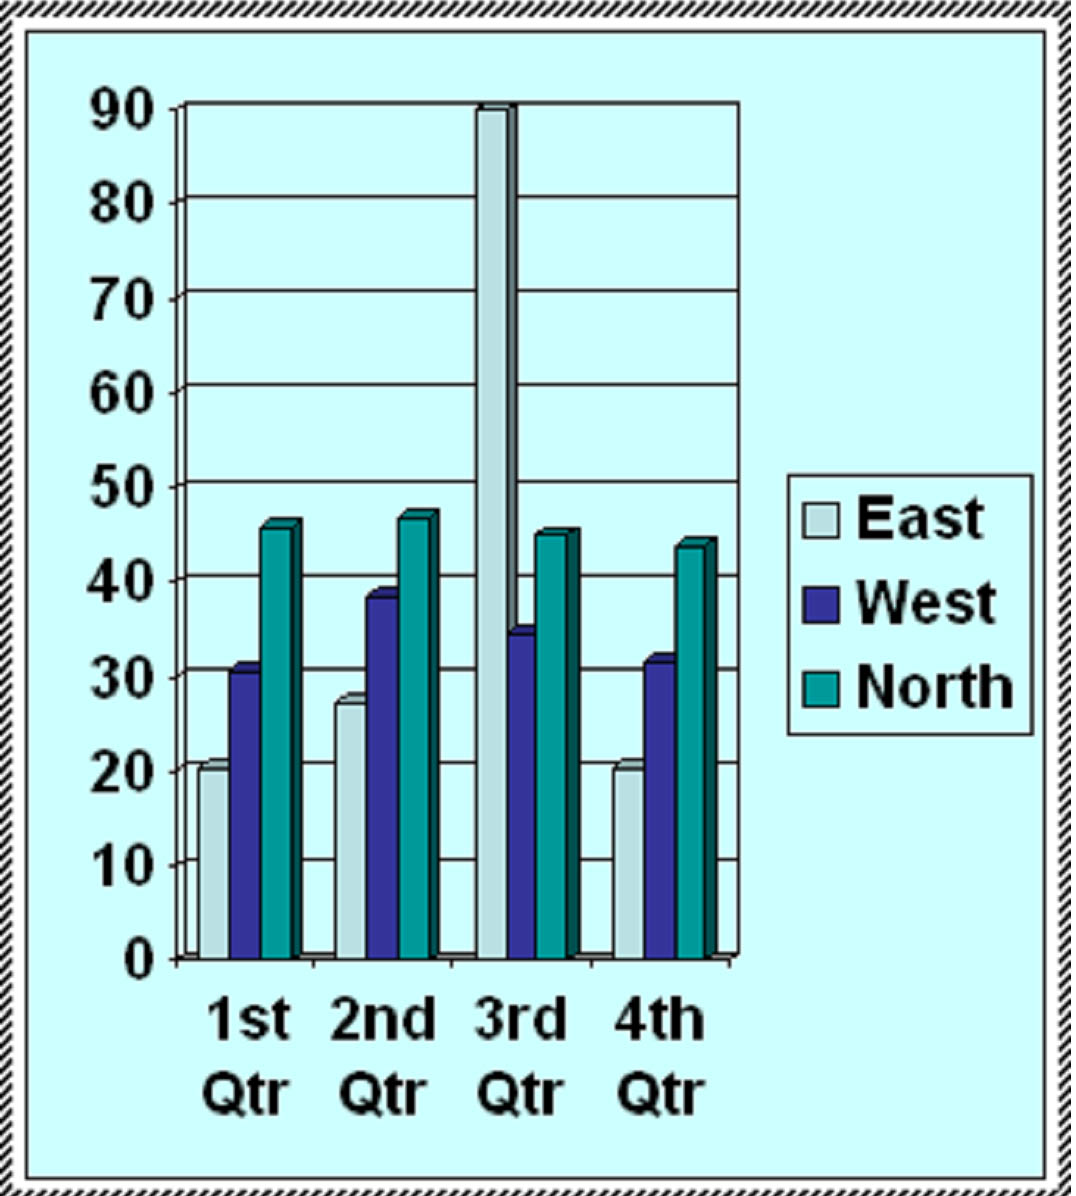
A chart will automatically be inserted onto your slide, as shown below.
Manage Chart Data
You can go ahead and input your data into the spreadsheet shown at the top of the snapshot above. You can add more columns and rows if needed.
Format Chart
Once you have all your data entered into the chart, you can start to format it. Right click in the white area around the chart to format the chart area.
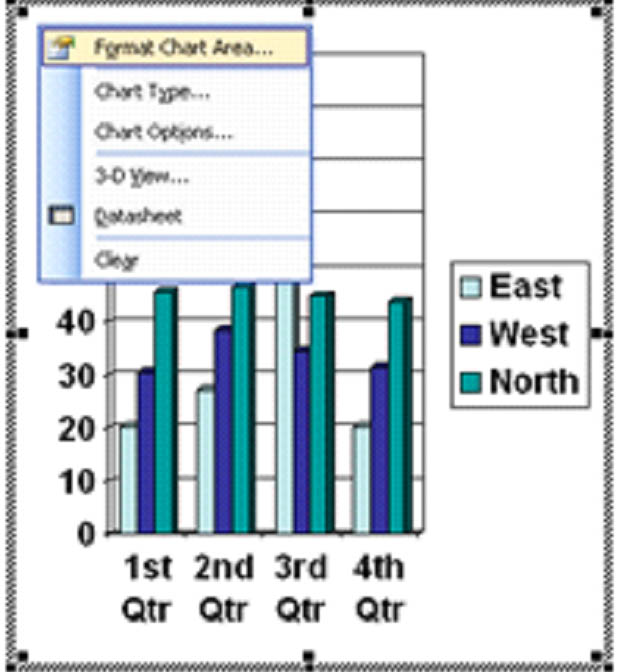
Select Format Chart.
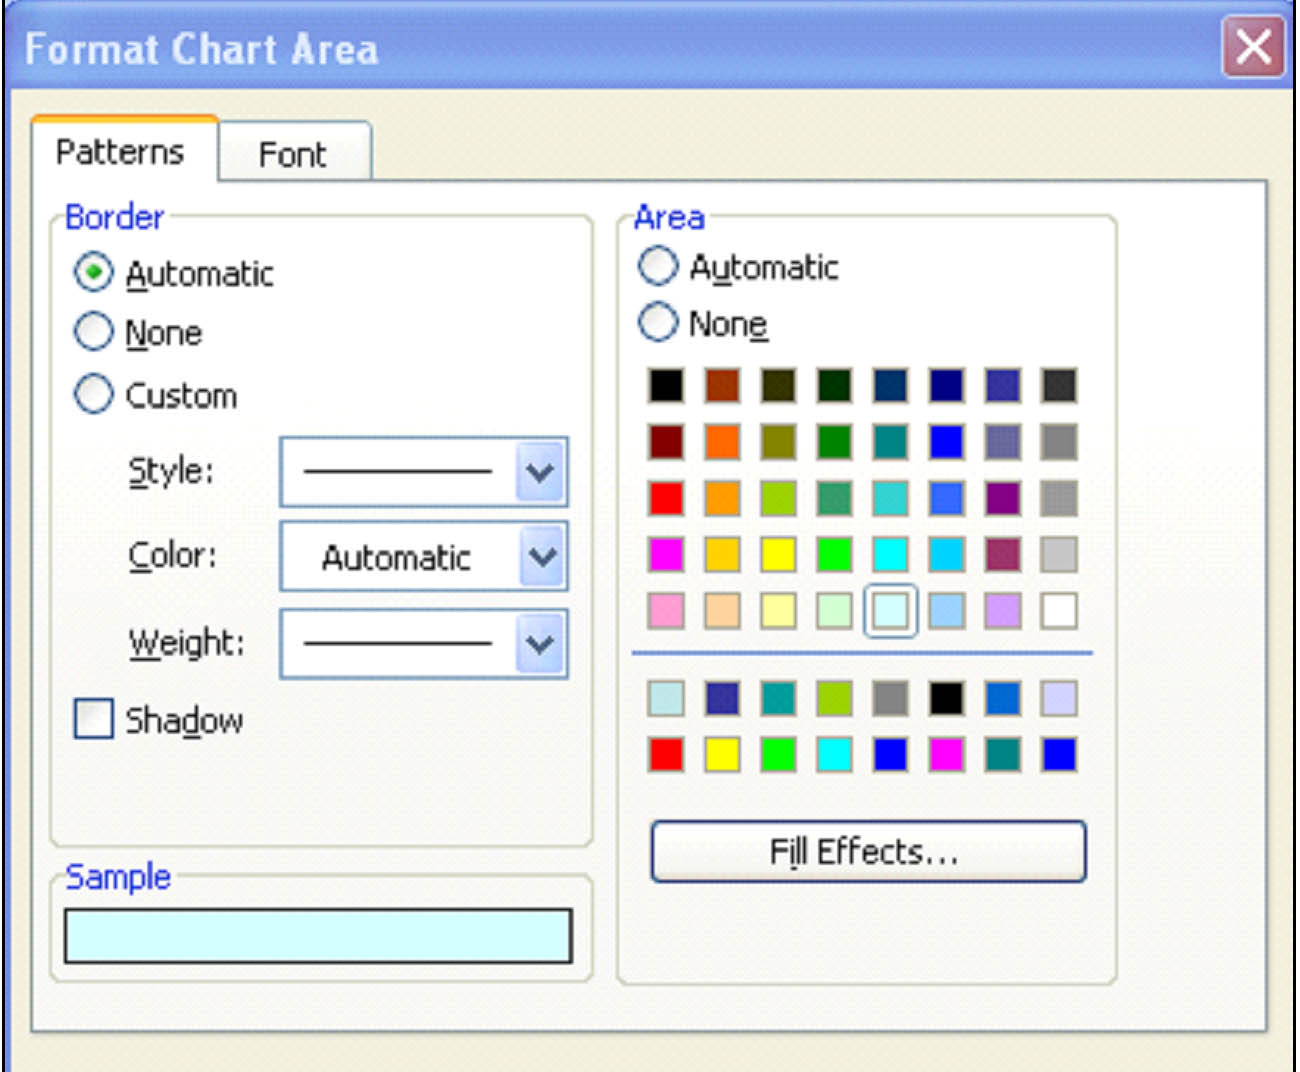
In this dialogue box, select if you want a border around the chart, and what color fill you want – if any.
In the snapshot below, we've added a border and a fill color.
If you want to change the font used in the chart, click the Font tab on the dialogue box above.
You can also change the type of chart that is displayed by right clicking in the chart area as you did above.
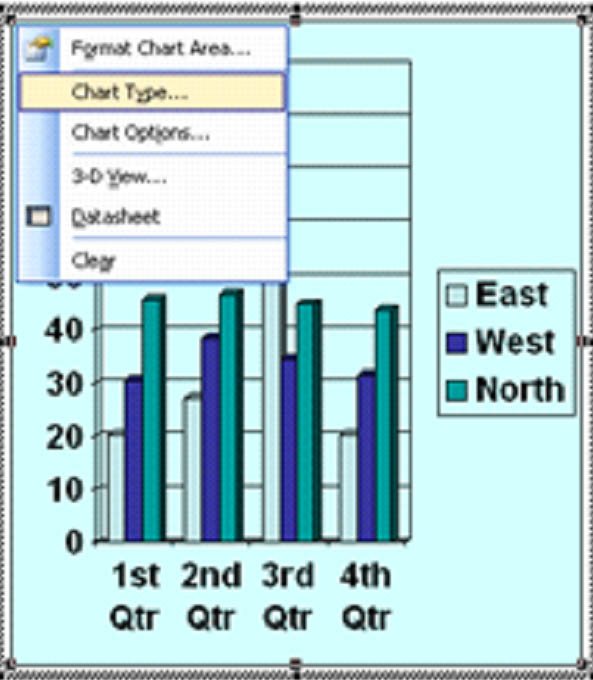
Select Chart Type.
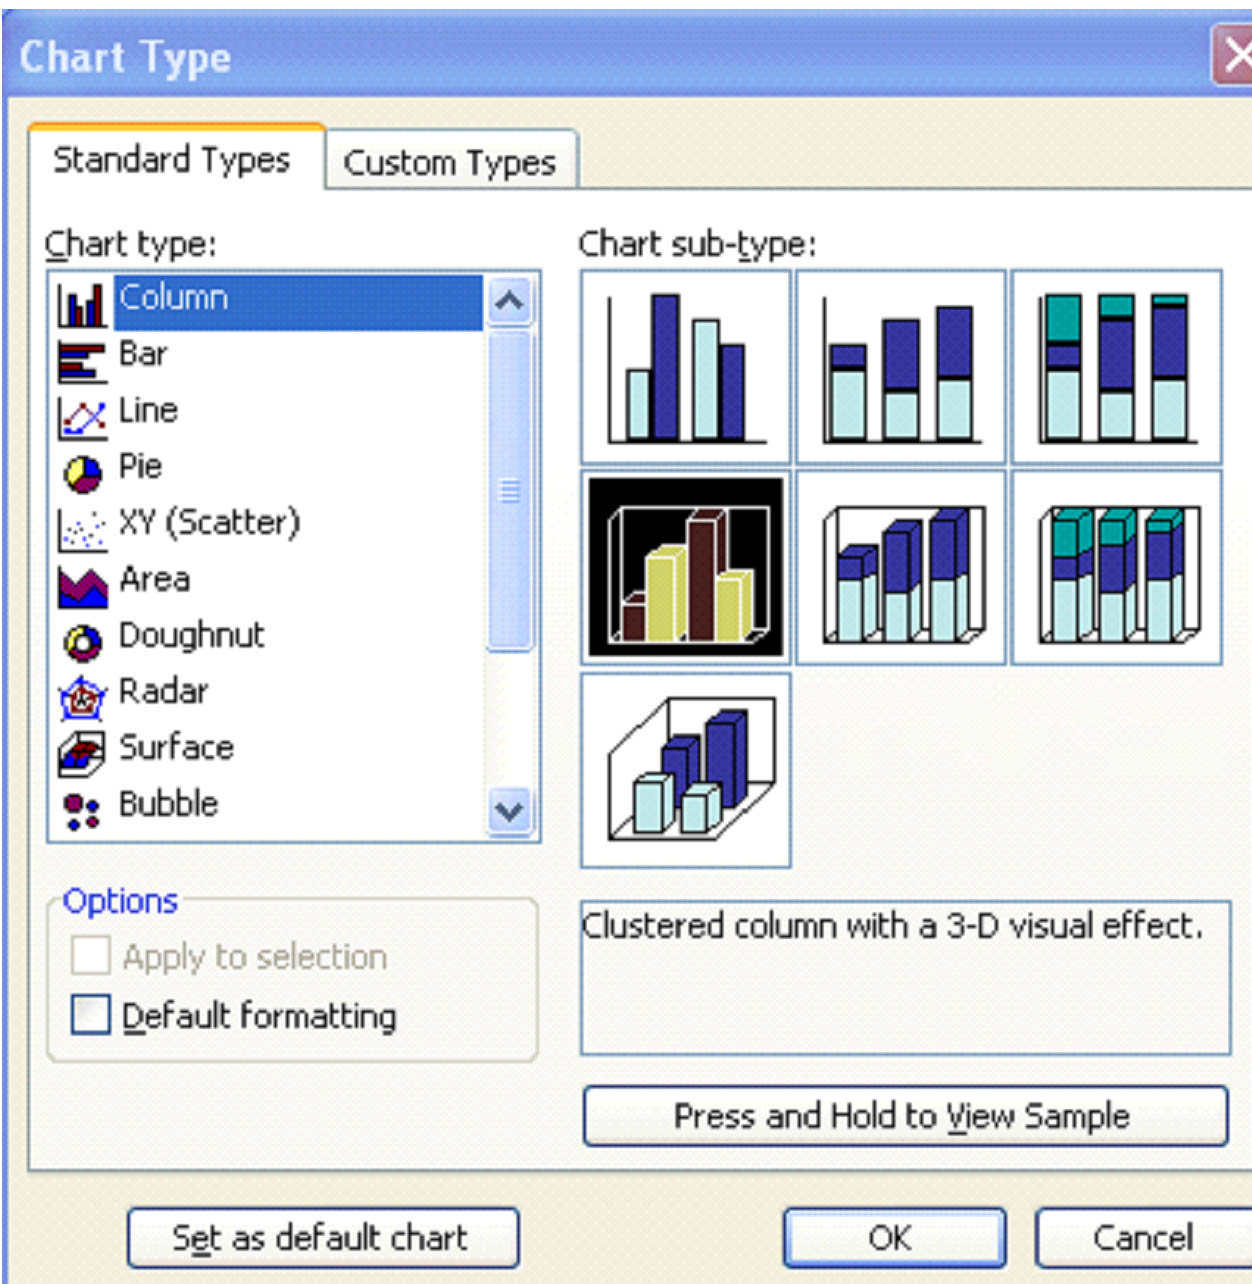
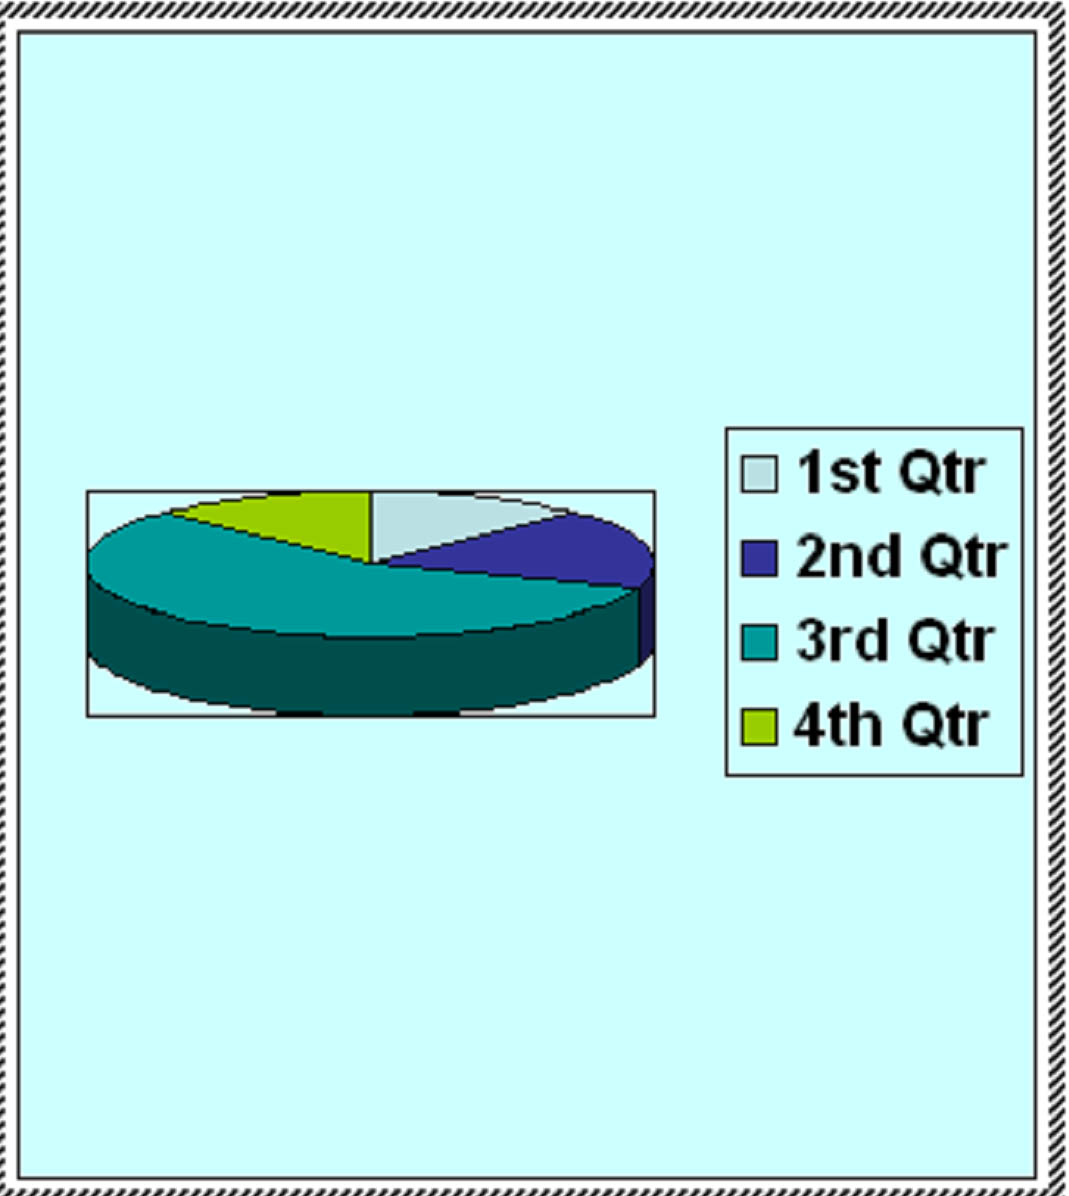
For this example, we're going to choose the Pie chart.
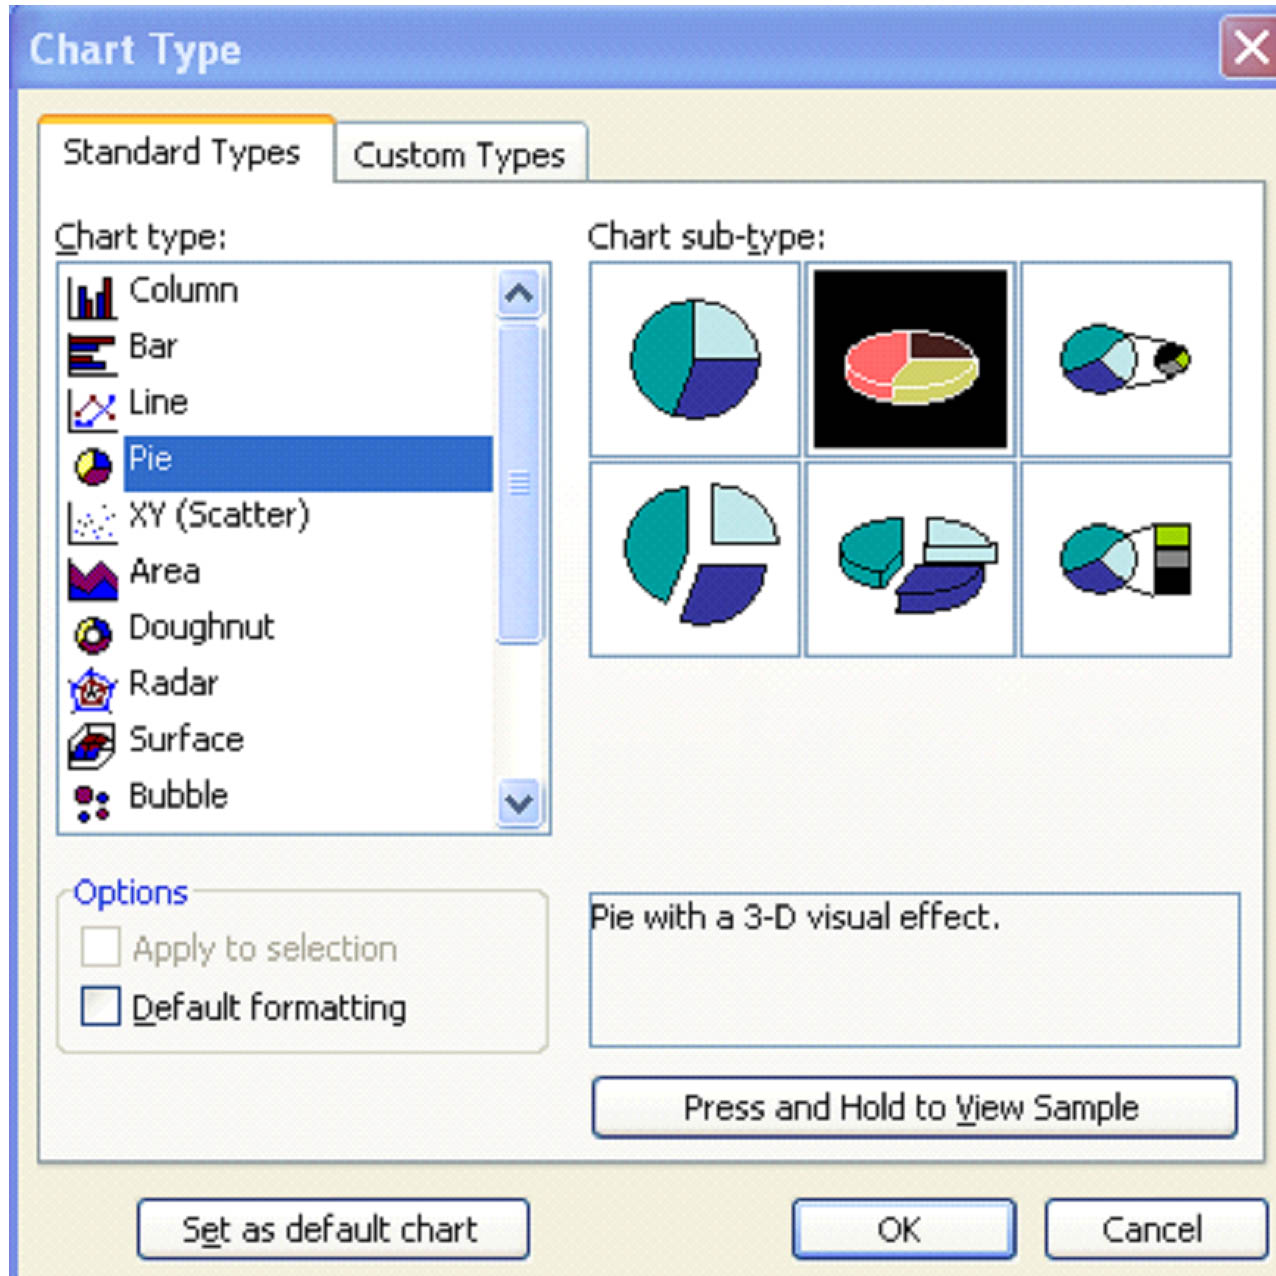
Click OK.
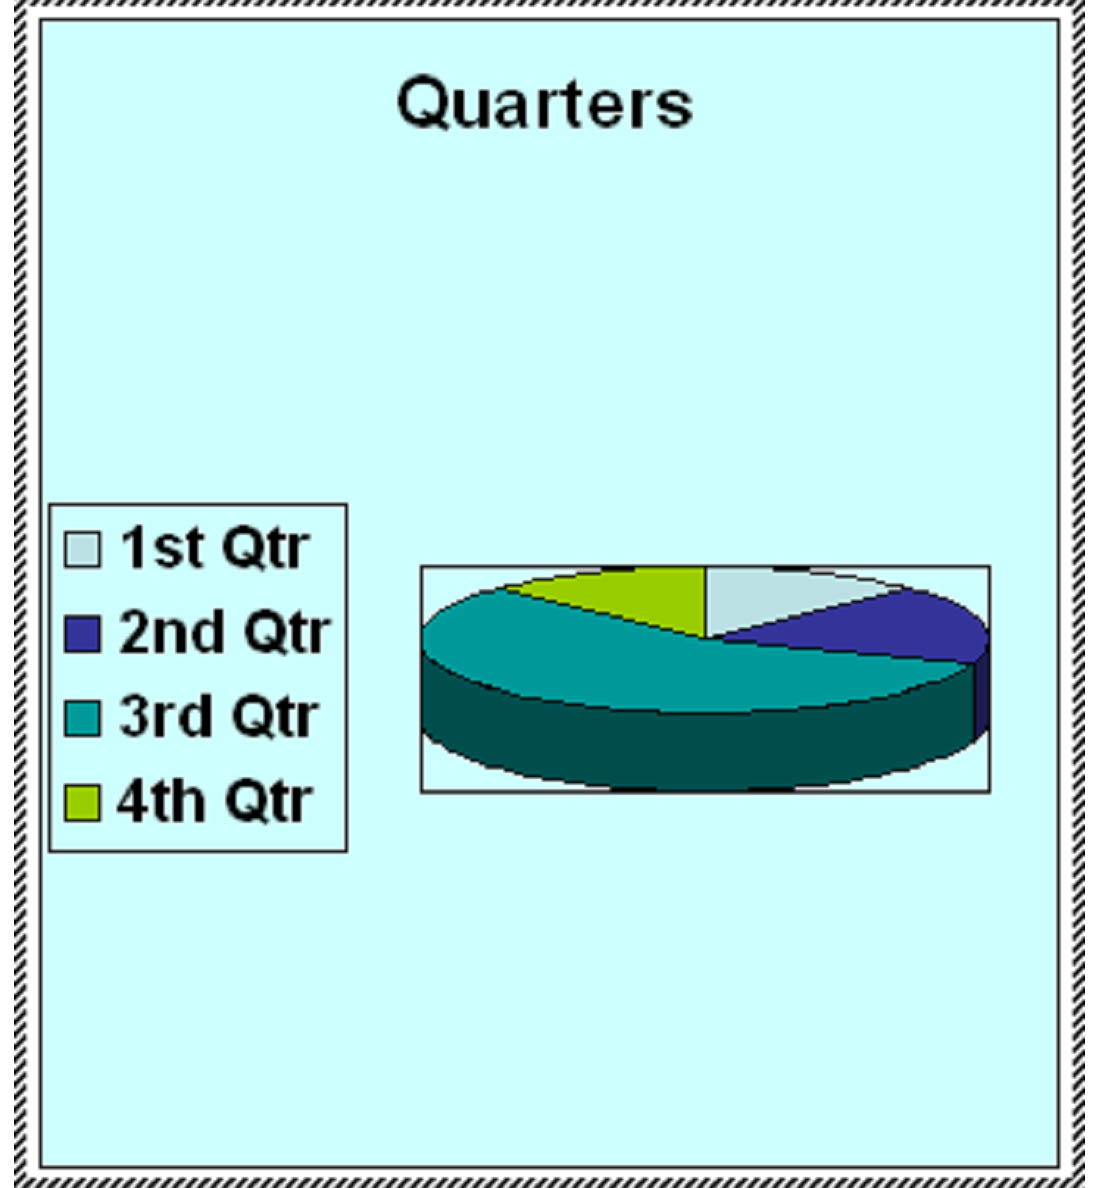
We can also add a chart title, change the way the legend appears, and make other changes to the chart. Right click in the chart area again and select Chart Options. This dialogue box will appear:
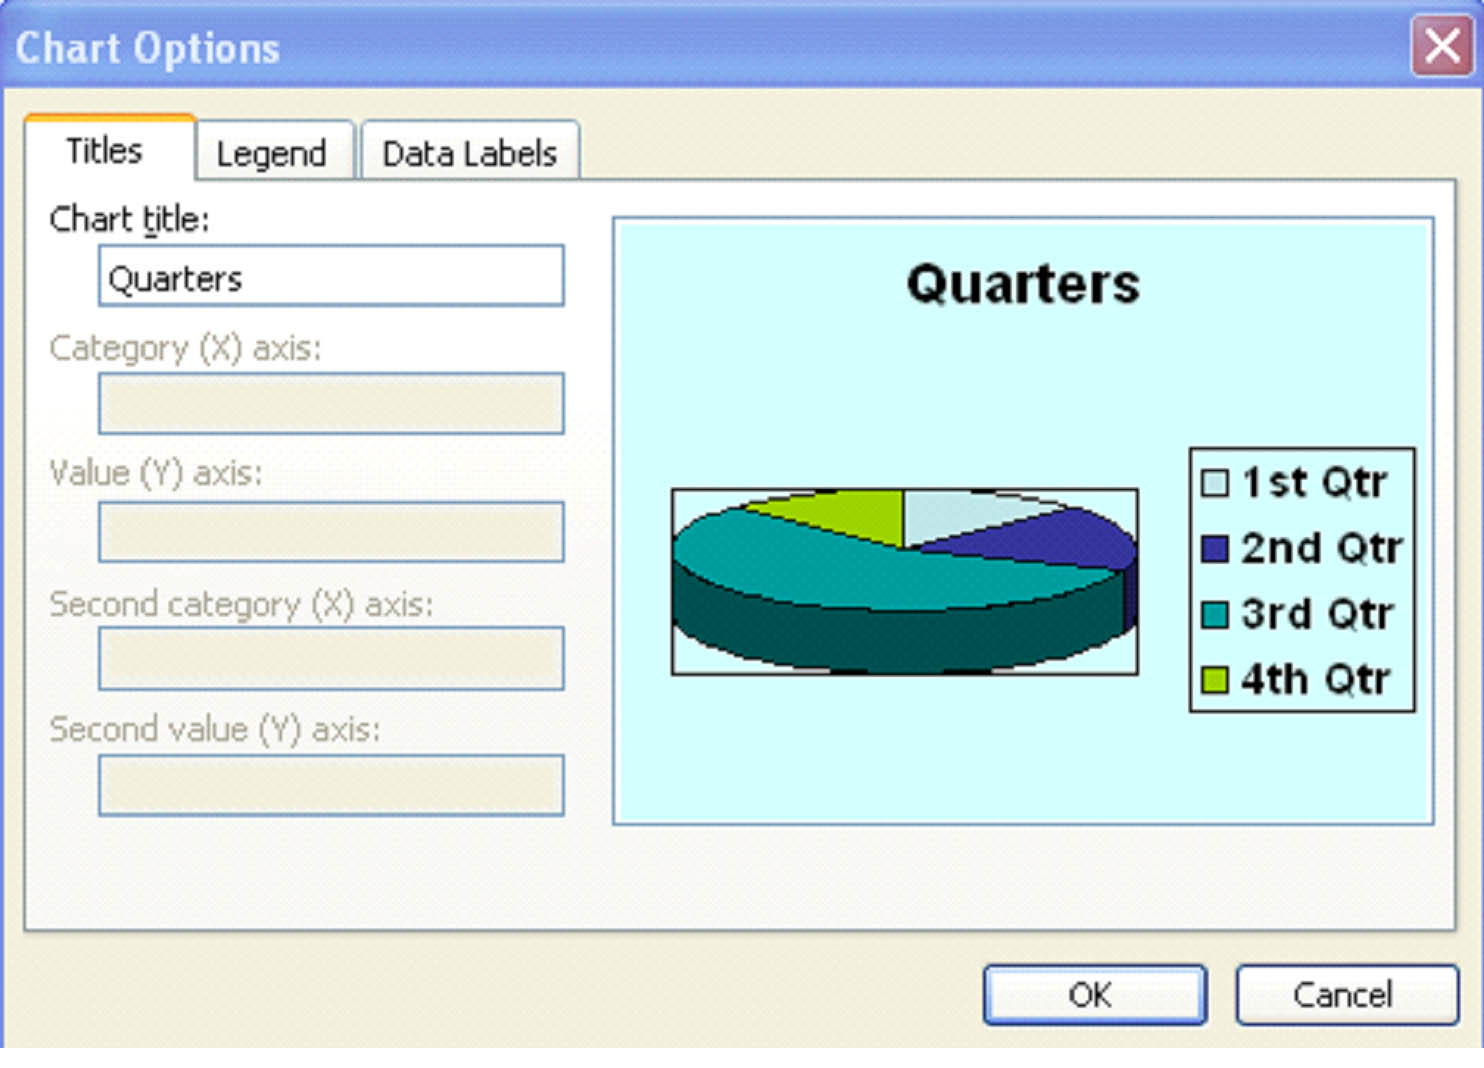
We've titled our chart "Quarters." Now we're going to edit the legend's appearance by clicking the Legend tab.
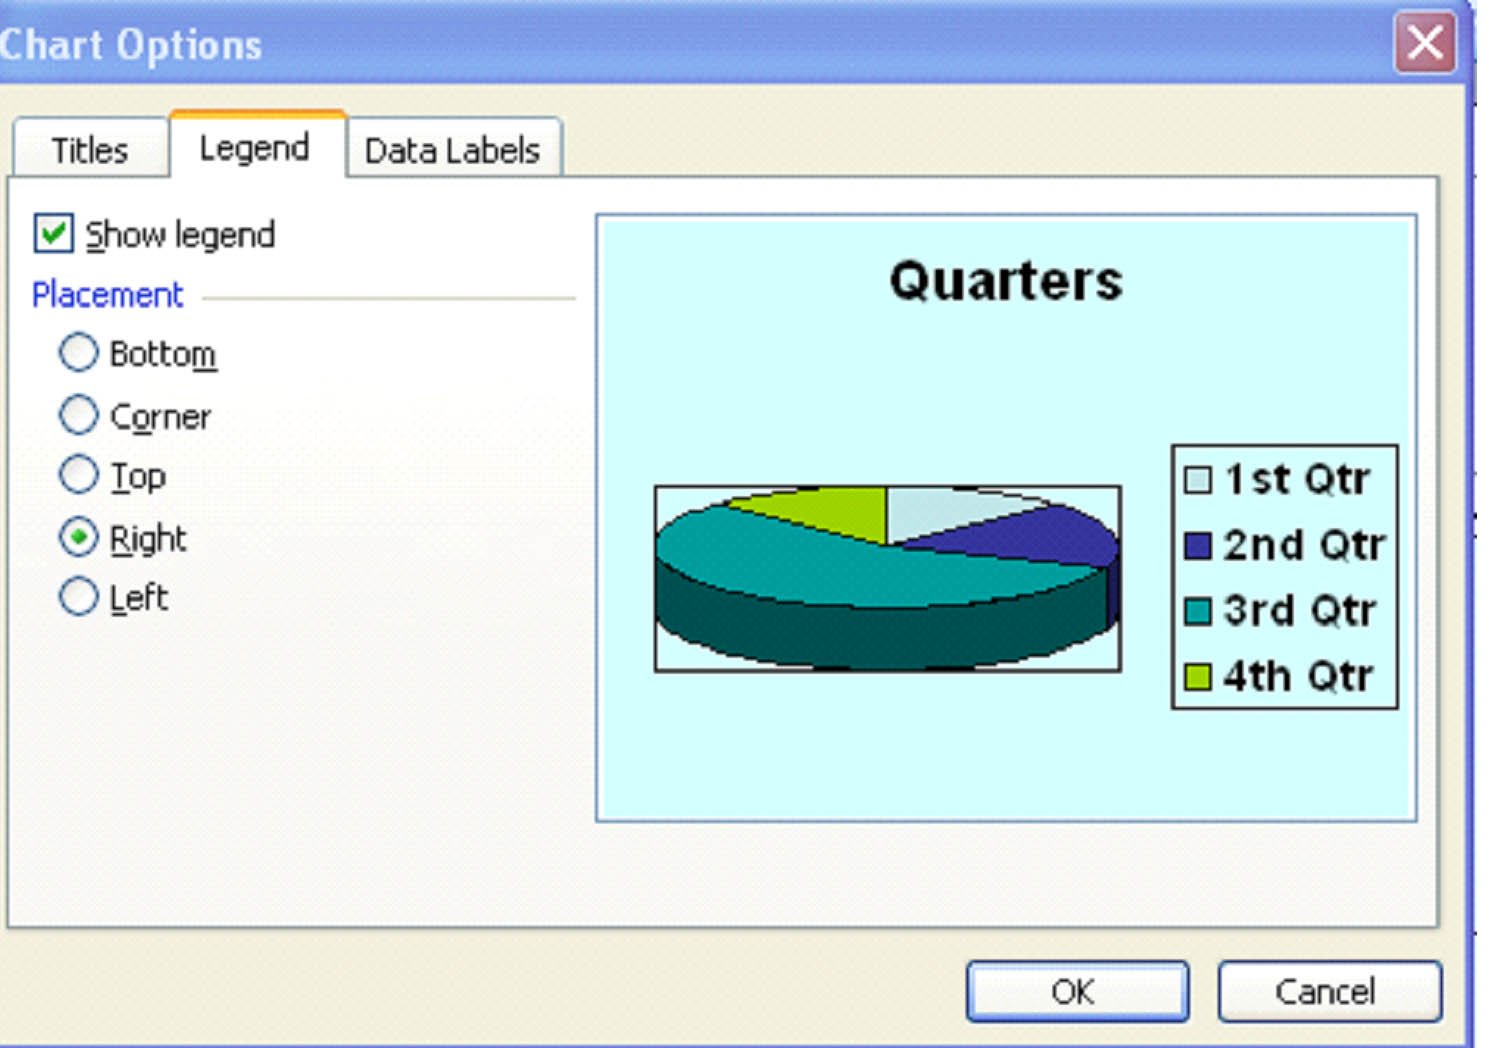
We're going to have the legend appear on the left hand side of the chart, rather than the right hand side. Then, we click OK to save the changes.
Charts in PowerPoint 2003 are as easy as pie. No pun intended. But, of course, as with anything, the more you work with them, the easier it will become.