Working with the Report Header and Report Footer
The Report Header and Report Footer appear by default in every new report you create.
In the snapshot below, you can see the Report Header and Report Footer in Design view.
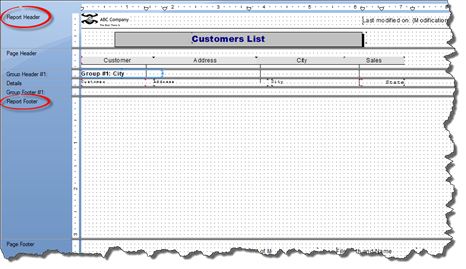
You can easily resize either the Report Header or Report Footer by dragging on the double bars.
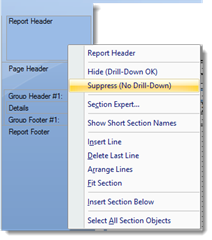
In addition, you can hide or suppress the Report Header and Report Footer so they do not appear on your report when it's printed. To do this, you can right click on Report Header or Report Footer, as we learned to do earlier in this course, then choose Hide or Suppress from the context menu.
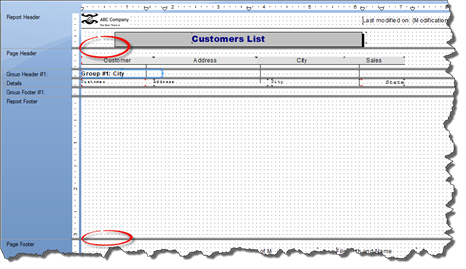
If you choose to suppress either the Report Header or Report Footer, diagonal lines will appear in the corresponding section in Design view. The section will not appear in Preview.
You can also hide or suppress the Report Header or Report Footer, as well as choose other formatting options, by going to the Section Expert.
To bring up the Section Expert, go to Report>Section Expert.
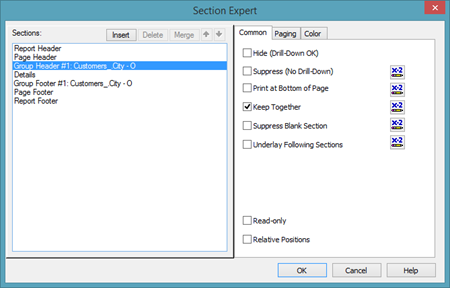
You will then see the Section Expert dialogue box.
![]()
All of the sections in a report appear in the Sections column on the Section Expert dialogue box.
Click the section you want to format.
We have chosen Report Header.
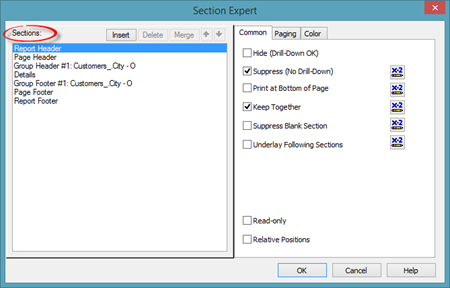
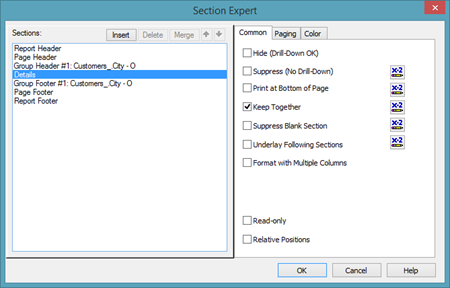
On the right side of the Section Expert, you will see three tabs: Common, Paging, and Color.
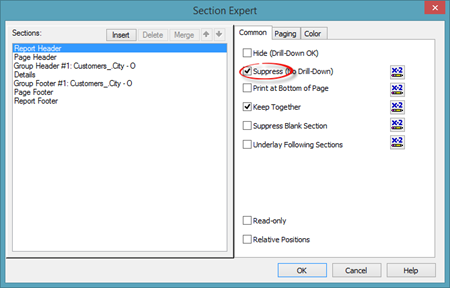
Under the Common tab, we can hide or suppress the Report Header Section.
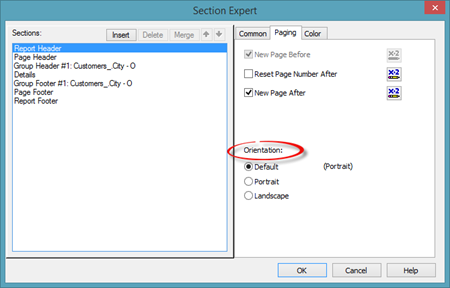
If we click on the Paging tab, we can make the Report Header section its own page in the report. Instead of the Report Header being a section at the top of the report page, it would be an entirely separate page.
To do this, we put a checkmark in the box for New Page After. This means that once the Report Header is printed, Crystal Reports will start a new page.
![]()
Under the Paging tab, we can also change the page orientation of the Report Header.
Under the Color tab, we can change the background color for the Report Header.
Click OK when to save your changes and close the Section Editor.
NOTE: These same formatting options are available for the Report Footer as well.
The Page Header and Page Footer
To format the Page Header and Page Footer, we will go back to the Section Expert.
As you can see in the snapshot below, we selected the Page Header section.
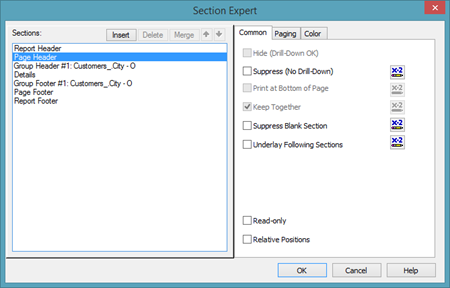
Under the Common tab, we can suppress the Page Header section. We can also suppress a blank section.
In addition, we can choose to Underlay Following Sections. When this option is checked, all of the other sections of the report that follow the Page Header will print over the Page Header until Crystal Reports gets to the Page Footer. This gives the report a watermark effect using the Page Header.
Under the Paging tab, we can reset the page number after a specified value.
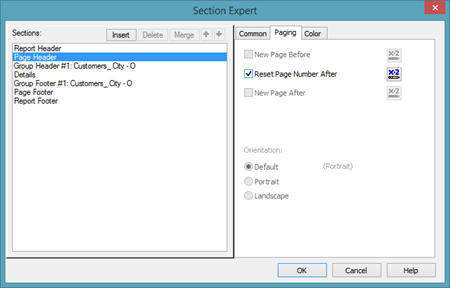
Please note that you can't set the page orientation for the Page Header or Page Footer because these sections are attached to the report page.
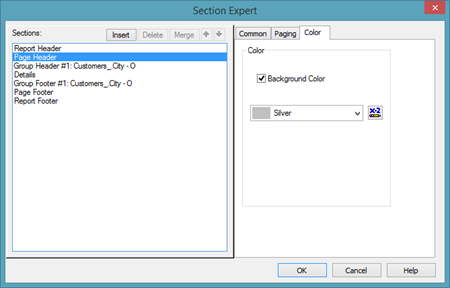
Under the Color tab, you can choose a background color for the section.
Click OK when you're finished.
NOTE: These same formatting options are available for the Page Footer as well.
The Group Header and Group Footer
When we did that, a Group Header and Group Footer was added to Design View, as shown below.
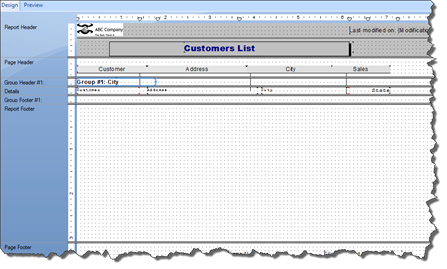
We can see Group Header #1 and Group Footer #1 since we created one data grouping in our report.
Now, we can format the Group Header and Group Footer by going to the Section Expert.
As you can see above, we've selected Group Header #1 in the Sections column.
Under the Common tab, we see options already familiar to us from when we formatted the Page Header.
Let's click on the Paging tab.
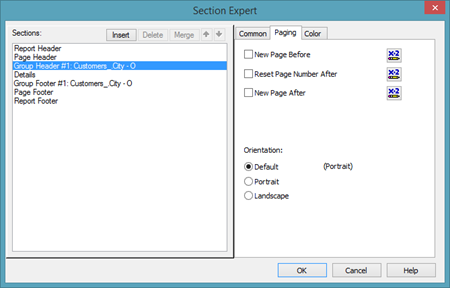
Like with the Report Header, you can force a new page after each group by placing a checkmark beside New Page After. You can also reset the page number after a specified value and change the orientation for the Group Header.
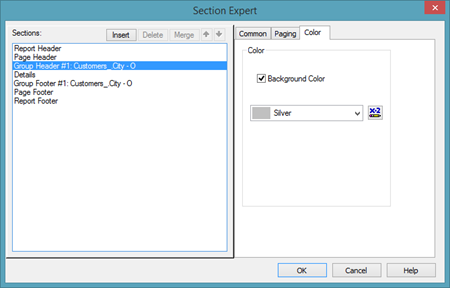
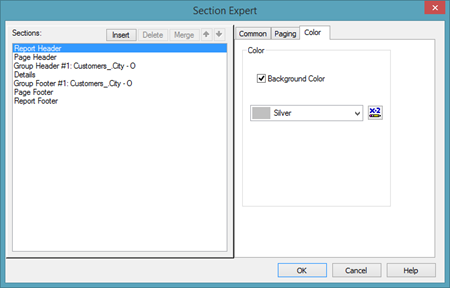
The Color tab is shown below.

Put a checkmark beside Background Color to add a background color to the section.
NOTE: These same formatting options are available for the Group Footer as well.
The Details Section
The Details section contains much of the same formatting options as the other sections of your report.
If you go to the Section Expert, then click on the Details section, you can see all the options that should be familiar to you at this point in the lesson.
However, the Details section also offers a few additional formatting options that are not available with the other sections.
Click on the Details section in the Page Expert, then click on the Paging tab.
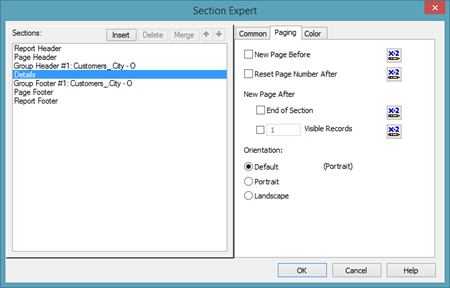
As you can see, you are given more options for paging. You can create a new page at the end of each section. You can also create a new page after a specified number of visible records.
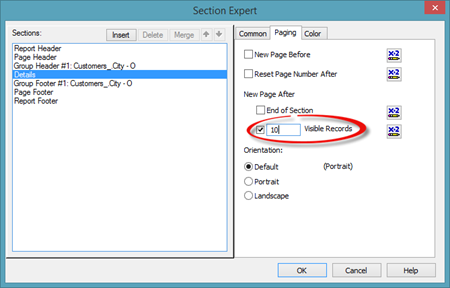
For example, we could say we wanted to create a new page after every 10 visible records. This would create a new page after essentially 10 rows in our report.
Another formatting option unique to the Details section is located under the Common tab.
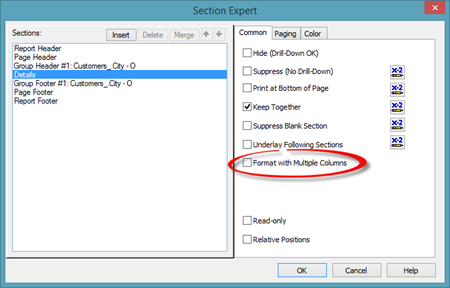
We can format the details section using columns by placing a checkmark beside Format with Multiple Columns.
When we put a checkmark in the box, a new tab appears. This is the Layout tab.
The Layout tab is pictured below.

Under the Layout tab, we can format the Details section into columns.
First, in the Detail Size section, we select how wide we want the Details section to be. After it reaches this width, it will repeat to another column.
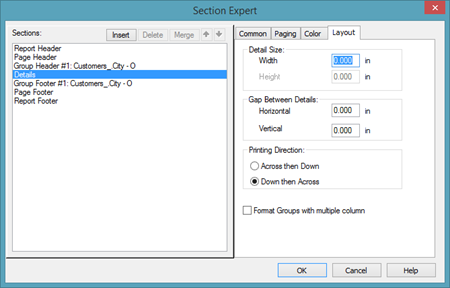
For example, we want our details section to be two and a half inches wide. Since we are using Portrait, we know our pages are 8.5 inches wide, which means we will fit two columns of data on each page.
Next, in the Gap Between Details section of the dialogue box, we can add spacing between the columns.
Under Printing Direction, we can decide how we want it printed, either Across then Down or Down then Across.
Once you create your columns, click OK.
About Linking Data Tables
Most of the data sources that you connect to using Crystal reports are relational databases. By definition, a relational database is a database that presents the data in rows and columns � and has multiple tables. Data in those tables are related to data in other tables within that database according to common columns. MySQL and Access are relational databases. Microsoft Excel is not a relational database.
The Reason for Multiple Tables
A table contains data. That goes without saying. You build a table with columns that list the type of data contained within the column, then rows that contain the actual data. If you only have one table, and that one table must contain all your data, you will probably find that you're constantly restructuring the table.
For example, if you have a table that contains a list of employees, their marital status, and the name of their children, you might create the following columns:
-
Employee ID
-
Employee Name
-
Marital Status
-
Name of Child
As you start to add rows of data, you might have some employees only have one child. However, you might have some that have two, some that have three, and so on.
The result is you are constantly restructuring your table. Plus, you have empty data fields as well.
Instead, you can create a table with the names of your employees and their rate of pay. Then, you can also create a table with a list of all the children. You then just have to link the child to the employee by using a column that is common to both tables. Perhaps it would be the employee ID.
By doing it this way, all you have to do is add children to the table that contains the list of children. You are only entering more rows, not columns, so no restructuring is involved.
In this example, the table with the employee names becomes the parent table. Of course, this isn't just because it contains names of parents. It is actually a parent table. The table with the children's names is the child table. You can create other child tables if you wanted as well to avoid having to restructure the parent table. These child tables would link to the parent table. It is called a one to many relationship.
About Joins
A join is an operation that's performed to connect two or more database tables based on columns that match in each table. Joins allow us to query the data, then see the results. There are several types of joins.
To help better explain these different types of joins, let's use an example.
Let's say we have a table that lists all members of a gym, then another table that lists all the lockers in the gym.
Each gym member is eligible for a locker assignment, so there is a Locker Assignment column in the members table. Some members, such as married couples, may share a locker, so they may have the same locker assignment. Some lockers in the lockers table aren't assigned to any members.
Now, let's look at the type of joins that can be used.
-
An Inner Join would be if you asked to see all members with lockers. You would see all data of members who are currently assigned to lockers. An inner join is where the two tables meet.
-
A Left Outer Join would be if you asked to see all members with their assigned locker numbers � if they have one. This could be a general member list. It could also be used to see which members do not have a locker. A left outer join is the whole of the left table (the members table), then any crossover.
-
A Right Outer Join would be if you asked to see all lockers, as well as the members who are assigned to each locker � if a member is assigned to the locker.
-
A Cartesian Join would be if you said show me something, but not specify what you want to see. A Cartesian join is when no join is specified, so the database or program has no way to relate the data in the two tables. As a result, you'd see all the members with their locker numbers, then all the locker numbers with the members assigned to those lockers.
By default, all joins are inner joins. However, you can change the type of join if you need to do so.
You can control the type of join using the database, but you can also use Crystal Reports as well.
Manually Linking Tables in Crystal Reports
When you want to create a report that will use multiple tables, you start by creating a blank report.
Next, we go to the Database Expert and select the tables we want to base our report on. When we select more than one table, we see a new tab called "Links" appear in the Database Expert.

If Crystal Reports can link the tables on its own, it will do that for you.
If Crystal Reports hadn't found any links, we could click the Link button in the Auto-Link section to try to link fields by name or by key.
If Crystal Reports was still unable to link the tables, this message appears:
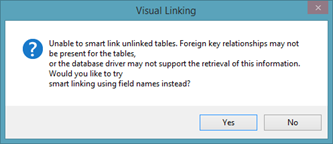
Click Yes.
You will then be taken back to the database expert.
Since Crystal Reports was unable to find and create any links, we will have to do it manually.
Here is the Link tab in the Database Expert again.
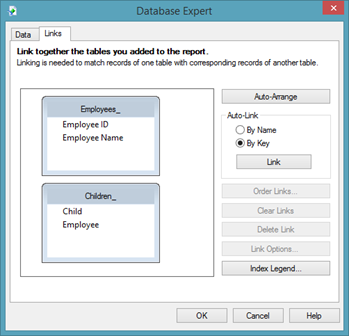
We want to link the Employee Field in Sheet_1 to the Last name field in ListCustomer_.
To do this, click on the Employee field and drag it to the Last Name field.
You can see that the link is now created.
Click OK.
Both tables now appear in the Field Explorer.
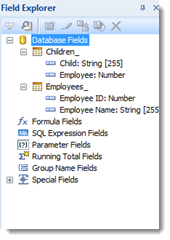
We are going to add the fields from our parent table to the report.
Manually Enforcing a Join
Take a look at the report we've created below.
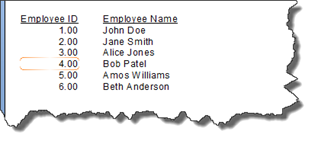
From the parent table, we've added the Employee ID and Employee Name to our report.
In Crystal Reports, joins are not enforced by default. This means we can't see which employees have children and which ones don't. To see this, we have to drag a child's name onto the report from Field Explorer.
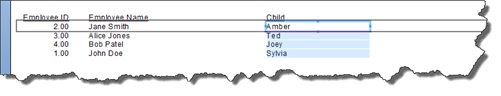
When we do this, we can now see which employees have kids, and their kids' names.
If we delete the Child field, we then see all employees again, but we can't tell which ones have kids and the names of those kids.
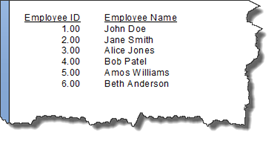
In other words, the join is not enforced until we drag a field from the second table onto our report. The join that is then enforced is an inner join.
Changing the Join Type
Right now, when we drag a field from the child table to the report, we see the employees who have children, as we saw in the last section. This is an inner join.
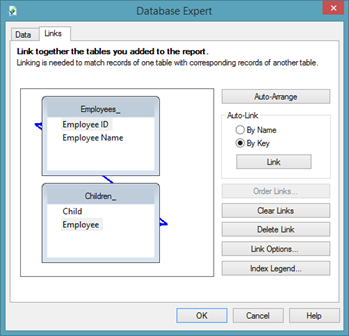
To change the type of join, go back to the Database Expert, and click on the Links tab.
Click on the link to make it active (blue).
Click the Link Options button.
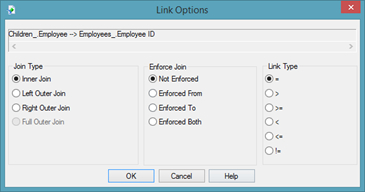
Select Left Outer Join.
Click OK.
![]()
Click OK to refresh the report data.
Removing a Table
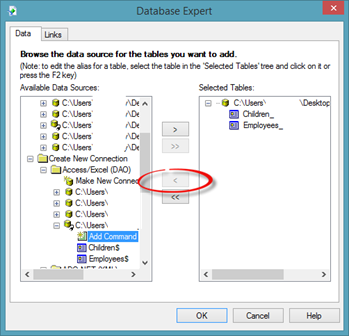
If you want to remove a table from a report, go to the Database Expert.
Click on the name of the table you wish to remove in the Selected Tables column, then click the arrow button.
If the table you remove contains any fields that you've placed on your report, those fields will be removed from your report.
Crystal Reports will let you know that fields in the report come from this file. It won't tell you what fields, however.
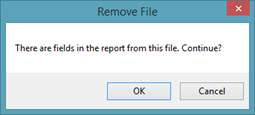
Press OK to continue.