Creating Custom Reports
Before you create a custom report, you have to decided what you want the report to display. Do you want to focus more on conversions? Are you building a comparison between data? Do you just want an aggregate report of certain referrals? Map out your target before you begin building a custom report.
You can add any number of data points and drill-down options. For instance, let's say you want to view a custom report based on the number of people who use your internal website search function. You want to know how many people run a search for products, but you also want to know what browser they are using. This type of report can tell you the main browsers being used by search users, so you can customize and build future pages based on user browser preferences. This article will use this business rule or question to build a custom report in Analytics.
Log in to your Analytics account and click "Customization" at the top of the screen. Click "New Custom Report" to get started. Google Analytics starts the wizard shown in the image below:
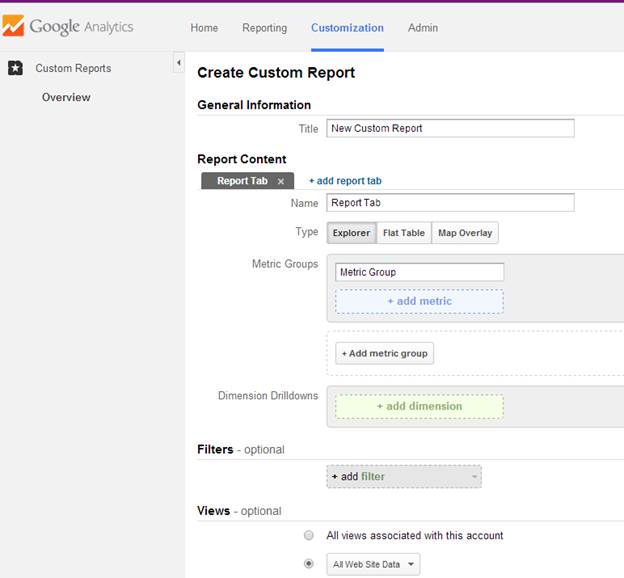
First, give your report a name. This can be any recognizable name.
Next, you want to choose a metric group. Metric groups are the main data points collected by Google Analytics. You have a number of metric groups, but if you're not sure which ones to choose, go through the default template reports in Analytics to view the data displayed. You can also do a search when you click the "Add Metric" button. In this example, we'll choose "Sessions with Search." The "Sessions with Search" metric counts users who search on your website (not the search engines) with open sessions. Remember, each time a user opens your site, a session is created. Therefore, these metrics count each user who opens your site but a user can have multiple sessions on your site.
Under the metric section, you are asked to choose a dimension drilldown. The dimension drilldown section can be considered a "metric within a metric." In this example, we're creating a report based on the number of users who run an internal search. However, we want to see the browsers for these users. The browser in this example is the "metric within the metric."
Click the "Add Dimension" to see a list of dimensions you can add to your report. In this example, type "Browser" in the search box. You'll notice that you can choose browser or the browser version. Click "Browse" to add it to your dimension.
You can add any number of metrics and dimensions. In addition to adding these metrics, you can also add filters. Remember, filters block data from showing up in your reports, so make sure you want to filter out data before you add filters. To add a filter, click the "Add Filter" button. For instance, suppose you only want to see the big three browsers (Internet Explorer, Chrome, and Firefox). Type "Browser" in the filter search and choose "Include." Type "firefox|chrome|internet explorer" into the regex string text box. Choose "Regex" from the dropdown that defaults to "Exact."
The final part of your custom report is choosing a view to assign the report. If you only have one website assigned to your Analytics account, you might see "All Web Site Data" as an option. Click "Save" to save your report.
After you click "Save" your report opens. Of course, you have no data immediately, but you can return after a few days to see your report at work.
Sharing Your Report with Other Users
There are two ways you can share your new custom reports with other users. First, you use the "Email" link at the top of your report to send it to someone in email. This is a one-time access point, so users only see a snapshot of the data when you send it in email.
Most webmasters want to share reports with other experts who can give them insights on traffic and trends or other employees in the business. You can share your reports with any other Google user even if they aren't a part of your organization.
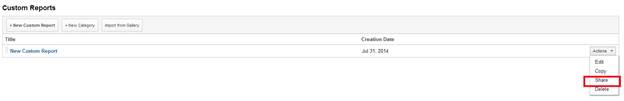
A window opens where you can share your report. You can either share it with the public and display it in the solutions gallery or share a template link. When you share a custom report, the settings are applied to a custom report and the end user's data is then imported into the report. This is a good way to share reports with other employees that you've set up. The result is that you control the reports and the employees can then read the reports to apply changes to site layout, advertisements, marketing or SEO.
You can also import pre-made custom reports from other users. Remember, your data is always kept private whether you import a template or share your custom reports with someone else. Pre-made custom reports shared in the gallery will save you a lot of time.
Click the "Customization" menu item at the top of the Analytics window. Click "Import from Gallery." Google opens a huge collection of custom reports that you can use without requiring any time to create them yourself.
SEO
Search engine optimization (SEO) is important for your ranking and metrics in Analytics. SEO is a complex topic, because there are hundreds of factors that go into determining your search engine rank. Google Analytics tracks all search engine traffic, but most site owners target Google. Some SEOs believe that targeting Google will lead to rank in Bing and Yahoo. Overall, you should create a great website for users, but it's also important that your code leaves breadcrumbs for search engines to understand the significance of your content and your target audience.
There are a few reasons you want to combine these two tools.
1. You want to identify duplicate content through pages shown in Analytics and pages ranking in Webmaster Tools.
2. You think your Analytics code isn't set up properly and you have more traffic than Analytics is reporting. Remember, Analytics uses JavaScript, so people with JavaScript disabled won't show up as users or sessions in Analytics.
3. You have pages that don't have the Analytics code but you think they are receiving traffic.
4. You have pages that get no traffic, so you want to identify any crawl errors.
Linking Webmaster Tools and Analytics
Google has a cloud application called Webmaster Tools. Webmaster Tools connects with your domain to let you know when Google has issues crawling your site, indexed page numbers, backlinks, the time Google takes to crawl your site and several other SEO related metrics connected with Google's search engine.
Just like Adsense and Adwords, you need to give Analytics permission to access your Webmaster Tools account. You start by logging in to Webmaster Tools and clicking "Manage Site" next to the site you want to track. When the Analytics window opens, click the web property you want to use and click "Save." Now, you can view your Webmaster Tools data in Analytics.
One issue to note: Google Webmaster Tools is not real-time. It's also rounded data. Google Webmaster Tools and Analytics rarely match up when you review both platforms' data. Don't try to reconcile data by matching values in both Webmaster Tools and Analytics. For instance, Analytics and Webmaster Tools show you keyword data. Webmaster Tools shows you the data found on your site, and it ranks the phrases as the search engine algorithms see on your site. In Analytics, phrases are used for Adwords and search. In other words, data is taken from different metrics.
Webmaster Tools Data
Webmaster Tools is a lesson in and of itself, but there are some major graphs and data you should check out when you work with your website SEO. When you open the dashboard, you're presented with some basic graphs just like you see when you open Analytics. The following image shows you a basic Webmaster Tools dashboard image.
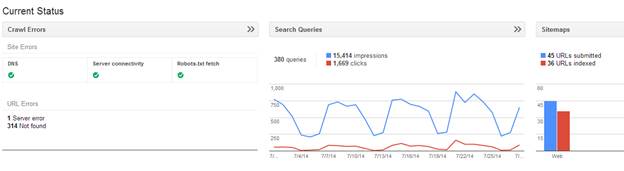
Notice some of the verbiage in Webmaster Tools is the same as what is in Analytics. The center "Search Queries" graph is what most webmasters focus on. This graph tells you the number of times your site appeared in a search. This metric is counted as "Impressions." This graph doesn't show you your position or page in the search engine results pages. This value is just the number of times your pages showed up in a search whether it's the first position or the 1000thposition.
The red line in the search queries graphic shows you how many clicks you received from search impressions. This is one area where your Analytics and Webmaster Tools will not match.
The first graph tells you if you have any errors with Googlebot. In the image above, all three areas have a green check mark. This means that DNS, connection to your server and robots.txt were successful the last time Google crawled your website. If you don't see green check marks for all three areas, you can click the "Crawl Errors" heading to drill down into more detailed information. Google will give you a bit more information about the errors. For most instances, the problem is a plugin that tries to detect user agent and fails or your web host is blocking Google's search bot. Both of these issues are common reasons why Googlebot continually has issues accessing your site.
In the far right graph, a list of URLs submitted in your site map and URLs actually indexed is shown. Site maps are XML files used to tell the bot where it can find your web pages. For the most part, Google will find your pages without a site map, but this file helps the bot find pages that aren't linked on your main pages. Google rarely indexes all pages, so it's not uncommon to have more URLs listed in a site map that are actually indexed.
When it comes to SEO, the two areas most SEOs are concerned with are the search queries section and backlinks. The center graph shown in the previous image was the search query overview. Click the search query graph to view more. After you drill down into this graph, you'll see more detail. The detail is in the search phrases listed under the graph. These phrases are the keywords that your site is ranking for. You can also see your CTR (click-through rate) for these phrases. You combine this report with your Adwords and session, users and pageview reports to find out how well your site is doing with search engine users. You might rank well, but if you aren't engaging users, it's only a matter of time before search engines devalue your site.
In the "Search Traffic" section, click "Links to Your Site." This section is also important for most webmasters. After Google Penguin, manual penalties were also sent to webmasters with unnatural links. You can identify unnatural links and use the disavow tool to manage any spammy links that are pointing to your site.
One main link between Google Analytics and Webmaster Tools is your landing pages. Most landing pages are very specific to the target audience, but it takes some time to understand the right layout, content and call to action before you understand your users' reaction and engagement. Webmaster Tools tells you some basic questions such as:
1. What are the backlinks to the landing page?
2. Are there any errors on the page?
3. Did Google find any security issues on the site?
Using the above information, you then combine your data with Analytics data for the same landing page. With Analytics, you can then ask the questions:
1. This page has several backlinks, what happens when users go to the landing page?
2. Is there engagement from search users, social media or both?
3. Are users sharing my page?
4. Did my page lose search engine visibility after having an outage?
5. You've optimized your pages for certain phrases, but are you getting search engine traffic from those phrases?