After you perform the initial Analytics setup, you're ready to go. Wait about 24 hours to start seeing data in your Analytics dashboard. Even though you need to wait for data, you can still begin the process of familiarizing yourself with the main Analytics dashboard.
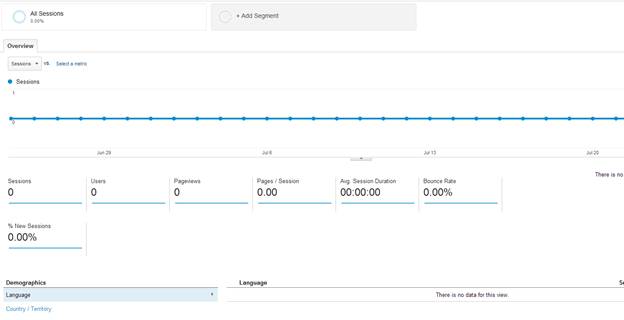
The first important part of the dashboard is the date time span in the top-right corner (not shown in the image). The time frame defaults to the current day when you first open your Analytics account. Once you start working with your Analytics data for several months, you can edit the date range to view sessions and data for a specific time frame.
Sessions
The main graph is named "Sessions." A session is the main foundation for each calculation and visitor. A session is how Analytics identifies engagement on your site. It's the length of time from when a user opens the site and ends when the session expires or the user leaves.
A session starts when a viewer opens your website. A session's length of time is set in the Google Analytics Admin section. Google defaults sessions to 30 minutes, but you can change the settings in your Analytics code to have a user session last for four hours. The setting is in the "Tracking Info" section under "Session Settings."
When you extend the time for a session, it means whatever the user does on your site within that period of time is consolidated under one visit. A user can open your website in multiple browsers or tabs and in essence create multiple sessions, but generally a user creates one session after visiting your site.
Each time a user clicks a link, a button or interacts with your site in some way, Google automatically resets the session time out. For instance, if a user named Jennifer opens your site, Google begins the countdown from the set session time. If the time is set to 30 minutes, it begins the countdown from 30 minutes. If Jennifer clicks a link two minutes into reading your site's content, the time on the next page is reset to 30 minutes and the countdown starts over. This continues to happen until the session time runs out or the user leaves your website. If Jennifer takes a 32-minute lunch break and comes back to your site to continue to browse, a new session opens and the new session uses the session settings.
You extend the session timeout for several reasons including 1:
1. You have users log in and automatically log them out after a certain time frame.
2. You have long pages of content and expect users to spend more than 30 minutes reading content.
3. You run advertising campaigns that last for a specific amount of time.
Most webmasters work on visits and sessions. This graph gives you a good representation of how well your site is doing overall in terms of visitors.
Users
The "Users" number is a bit more self-explanatory. A user is counted each time they access your site. If a user opens your site on August 1 and September 1, only one user is counted in this section, because it's only one user not two2. This is why sessions and users won't normally add up. One user can have several sessions, but those several sessions only count as one user. Typically, on popular sites, the Users graph has a much smaller number than sessions.
Pageviews
The "Pageviews" count is the aggregate number of times a page is viewed. All pageviews are counted regardless of the number of sessions or if the user is unique. For instance, if a user opens your site and navigates to a new page, two pageviews are counted. If the user returns to the first page visited, another pageview is counted regardless of the fact that the user is using the same session and viewing the same page twice. You can consider a pageview the total amount of times that the Google Analytic code was fired on a page, which happens each time the page is opened.
Pages/Session
Pages/Session takes into account the number of sessions and the pages viewed by a user. Pages per session tell you how many pages a user visits. Of course, the same user can open multiple sessions, but this data is typically negligible. You use this percentage to identify user engagement on your pages. For instance, if you only average one or two pages for each session, you aren't grabbing your users' attention. If you average only one page each session, you probably have a poor bounce rate as well, which will be explained in the following sections. Pages/Session also counts repeated pages, so if you have users who return to the same page frequently, the second view of the same page is counted as an additional pageview for the session.
Average Session Duration
The "Average Session Duration" number tells you how long users typically spend on your site. This number ties in with your pages/session and bounce rate. If your bounce rate is high, then you probably have a low session duration. This number is also affected by the session time out you set in your preferences.
Google Analytics lets you set parameters for certain engagement actions. Basic user interactions include clicking a button or a link. Some website owners have other elements such as videos, and you can use these elements as engagement events. For instance, when the user clicks the "Play" button on a video, it counts as an engagement. Session duration counts the sessions between engagements.
Suppose a user opens your web page at 10am. At 10:05am, the user clicks the "Play" button on your video. He watches the video for 10 minutes until 10:15 and then leaves your site. The total duration is calculated by subtracting the last session activity time from the first activity, which is usually when the user opens the page. In this example, the total session time is 15 minutes.
The number on your main Google Analytics is an average, so the total session durations are added up and divided by the total number of sessions. This gives you the average time on your site for each user session. As a site owner, you want to see this number increase. User engagement is tied in with this number, and user engagement is pivotal for site success.
Bounce Rate
Bounce rate is one component that many webmasters focus on. Bounce rate also determines user engagement, because it determines if visitors stay on your site or immediately leave. Bounce rate is often misinterpreted as a user who leaves your site. However, bounce rate is different than an exit page. Also, a high bounce rate is expected from some types of sites.
A bounce happens when a user opens your page and leaves without any engagement. There can be multiple reasons for a user to bounce from a page. If your pages have poor usability, bad site design or a poor call to action, users are more likely to bounce from your site. However, some sites have inherently high bounce rates. For instance, if you run a dictionary website, users will open a page, find an answer to their query and bounce. This does not mean your site is poor. It just means users find what they are looking for immediately. Also, if you have a one-page website, unless a user performs some action on a page, opening the one page site and leaving is registered as a bounce. One-page websites also have a high bounce rate.
Most website owners should strive for a low bounce rate. The type of site also determines what you can expect in terms of bounce rate. Simple landing pages with only one call to action average 70-90% bounce rate 6. Service sites should strive for a 10-30% bounce rate.
Behavior Elements
Now that you know the fundamentals of the main Analytics dashboard, you can drill down into more detailed information for each graph. In the left navigation panel in the "Reporting" section, click the "Behavior" link. This section contains several behavior elements you use to identify user patterns, your site's speed, site content interaction and experiments. Some other elements such as Adsense and content are described in later sections.
Site Speed
A few years ago, Google announced that site speed would factor into ranking algorithms. The reason was based on user experiments based on the time it takes for users to evaluate your site and either engage in its content or bounce. On average, you have three seconds before you lose 40% of visitors to your page 1. Because of the multiple ways site speed affects site conversions and sales, Google Analytics added a site speed section to the behavior elements.
Site speed has a number of factors, so Analytics only gives you a sample of pageviews across your entire site. Site speed depends on the user as well as your own servers and code. The speed can vary depending on browsers, user location, broadband capabilities, and Internet congestion. If your pages are consistently slow, then you probably need to tweak some code, settings or even change your hosting company.
This section has a Map Overlay tab that lets you identify speed issues specific to a location such as a specific country or geographic area. Some countries have slower Internet than others, but it can be a pressure point for online stores that target those countries.
The "Page Timings" section is the most straight-forward. This section gives you reports specific to your pages. This report is important when you have important landing pages that you intend to use to grab conversions.
There are several factors associated with page speed. Some basic factors include:
1. Redirects such as 301 permanent redirects or 302 temporary redirects
2. Code base and how well it's put together
3. Server hardware including shared hosting vs dedicated or VPS
4. DNS lookup times
5. Size of your documents
6. Server response times (often based on server hardware)
7. External JavaScript libraries linked in pages
8. The user's broadband connection
Some of the above factors are completely under your control while others depend on your host and visitors.
Redirects occur when you tell browsers that a page has moved, so the browser must look up the current page, find the redirect, and send the user to the new URL location. When you set up redirects, limit them to as little as possible. For instance, you can chain redirects and each redirect is a call to the server. Don't chain more than two redirects.
Your code base is something you can control. The code base is the backend code that controls your dynamic content. The language doesn't matter as much as the way the coder handles the language. Some code has more affect on site speed than others. For instance, database design and code has a huge effect on site performance.
Most servers have a fast response time, but yours can slow down especially if you're using a shared host. Shared hosts have hundreds and sometimes thousands of other sites, so these sites can affect yours. The best way to fix a slow host is to move to VPS or dedicated servers.
Another factor is DNS lookups. When a user types a URL into the browser, the browser must first do a lookup for the IP address. This is done using DNS or name servers that have a map of IP addresses and domain names. Name servers aren't typically slow, but they can affect load time for a page. Unfortunately, you can't speed up a name server unless you switch name server hosts.
Google Analytics gives you suggestions on how you can speed up your servers. Some changes such as hosting script libraries in the cloud will help improve speed, but other issues can only be fixed by changing hosts. It's up to the site owner to determine the right plan for site performance.
One common way to speed up pages is to add JavaScript and CSS libraries to cloud servers. Cloud servers are located in data centers all around the world. When a user wants to download any HTML element, the cloud then sends the data to the user from the closest geographical location.
Experiments
The experiments section in site behaviors lets website owners create trial layouts. Site layout and speed are the two most important factors when engaging users. The experiments section in Google Analytics is divided into the experiments wizard, the reports based on those experiments and a list of experiments you currently run on the website.
Experiments are based on small changes between pages. You don't create entirely different pages with different content. The differences are subtle. For instance, you have your call to action on the left side of the page in one page and the variant experiment has the call to action in the center. These small differences can make a difference in conversions and engagement. With Experiments in Analytics, you can control the percentage of traffic that sees the variant page. Most companies choose to send 50% of their traffic to the variant page. This percentage will give you significant data you can use to determine which experimental page is more effective.
Before you can start an experiment, you need to set it up in Analytics. Click "Create New Experiment" to get started. The wizard starts with the following screen:
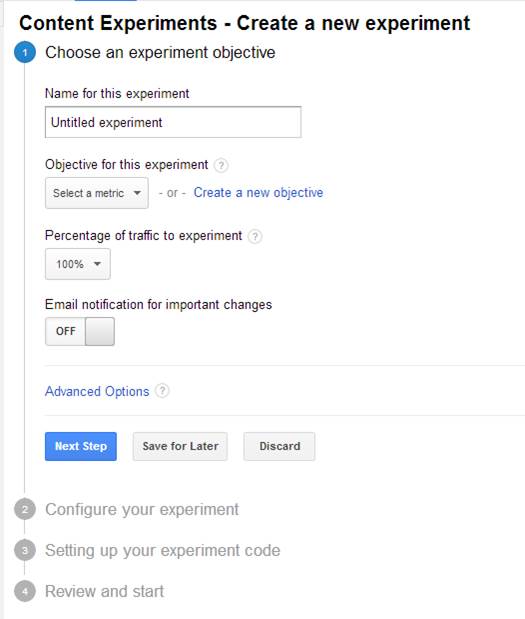
The first screen asks for basic information � a name, the metric you want to focus on and a percentage of your traffic to experiment on. The wizard defaults to 100%, but you can't make a comparison with 100% of your visitors receiving the same experiment. Use no more than 50% if you have a currently effective web page. If your page isn't converting, you can then increase the percentage.
The next screen asks for the web page you want to use and the variant web page you want to use. Experiments are based on the same content with different layouts. This means you want to use a variant that is similar to the existing page but creates a different layout that you believe will give you better engagement and conversions.
The next page in the wizard gives you the Analytics code you need to add to your pages. You add this code in the same way you added the Analytics main code.
After you create your experiment, Google Analytics gives you reports that you can use to evaluate which page layout is more effective. You can have more than one variant for your pages, so you can slice and dice a layout into what you think is better for conversions until you find the right one. Most marketing people use Experiments with Adwords ad campaigns. The result is identifying which ad campaigns are best for your ROI.
The reports are based on your original page. You can see the number of visitors sent to each variant page and the number of conversions. If your conversion rate goes up, you know your experiment is successful. If you find an experiment isn't doing well, you can also stop it from running in the Analytics dashboard.
Analytics does most of the evaluations for you. Look at your report and look for the up ( ) and down arrows (
 ). An up arrow means your metrics have improved. Two gray arrows (
 ) mean that there is no significant change to make an opinion. You should wait until you have several hundred visitors to your page before you make an evaluation. The more data you accumulate, the better assessment you can make.
The success or failure of an experiment is dependent on the type of website you run. Experiments can help you with the following questions:
1. Will a better call to action placement improve conversions?
2. Which font is easier for users to read?
3. Which navigation helps users find what they are looking for?
4. Will better image placement sell products?
5. Which image size is best for selling product?
6. Which layout engages users better?