The "Audience" section focuses on your readers' demographics, interests, and technology. In other words, the behavior section focuses on user behavior patterns, but the audience section lets you identify your readers' static properties.
The audience section is a bit easier to understand, because it's static and doesn't depend on user behaviors and trends. Even though the properties are static, they are still used to better target ads and marketing campaigns.
Demographics
Demographics must be enabled before you can use it. Click the "Overview" link under "Demographics" and click the "Enable" button. Google uses demographics to target ads for a better ROI with your ad campaigns. If you use Adwords, you should enable demographics reporting.
The two main demographics that you can view in Analytics are age and gender. If you run an ecommerce store, you can cater your store products and layout to your target demographics. The benefit is a much better ROI on ads when you know the age and gender group for your products. For instance, a video game site would target a specific demographic and a dress website would target another demographic.
Geo
The Geo section in the Audience tab gives you the language and location of your users. You don't need to enable this section, because the Analytics code on your pages will detect the location by the IP address. Language settings are sent by the browser.
Just like demographics, you can improve your ROI when you understand the geographic location and language of your readers. For instance, you might have a site in English but you want you have a lot of traffic from Germany. In that case, you'd hire a translator to create German site content and cater a section of your site to German visitors. This information can also let you tap into new revenue that you wouldn't otherwise know to target without Analytics.
Behavior
The behavior sub-section in Audience is different than the main Behavior section in Analytics. This section helps you identify how many users return to your site. The "New vs Returning" section is where most webmasters review data.
There are two main reasons you run reports in the New vs Returning section: understanding if your site is growing in visitors and determining how many of those users return to your site. You use the new user section to identify how many of your visitors are brand new. Is this number fewer or more than previous numbers? If it's more, you should drill down and find out where new users are finding your site. Search engines? CPC campaigns? Social media? This information helps you focus on the marketing campaigns that are currently working to bring in more viewers.
A main focus you should have is not only gaining new visitors from marketing campaigns, but also returning visitors. Direct traffic has a higher conversion rate than ad or search engine traffic. Direct traffic means your visitor remembered your site, liked it and typed the domain URL directly into the browser. Direct traffic is also free. In Analytics, you can combine reports to see which return viewers are direct traffic and what part of these direct traffic visitors converted to customers. For ecommerce stores, this is the most ideal situation � free direct traffic that purchased product.
In addition to identifying the number of users who return to your site, you can also identify the frequency at which users return and view a particular page. For instance, you might have a product page that several users return to after viewing it once. This could mean that users are shopping around for product, but it could also mean that there is a weakness on the page that doesn't' compel users to go from browsing the product to purchasing it. You could use Experiments to change content and a call to action. The issue could also be an error on the page. The issue should trigger a test and a review of the particular page.
The engagement section helps you understand the length of time users spend on your site pages. Typically, the longer a user spends on your site, the more he is engaged by your media or content. Take note of the page per session metrics. This metric tells you the number of pages users view on your site before they end their sessions. If you own a content site, you want users to view several pages before they leave. For landing pages, it might be normal for users to read the page and click on a button to buy. In this case, you wouldn't have many pages per session to consider the site a success. This is also true with affiliate sites. You would then tie in events and behavior when you review reports about site performance.
Technology and Mobile
Most new site owners don't understand the importance of the audience technology and mobile sections. These two sections are important when you design or redesign your site. These two sections are also important when you identify site speed issues and program your site.
The technology section displays three data points: browser, operating system, and network. Chrome updates automatically, but older Firefox and Internet Explorer browsers don't support some of the newer JavaScript libraries and CSS. Older browsers also don't support HTML 5. Therefore, if you see that your customers are mostly using older browsers, you should take this into consideration when you want to update your website design and code.
Having the user's operating system information also helps you identify technical issues with your site. While this information isn't as useful as browser, it still helps you understand your target users and the coding style you should stick to that caters to your primary visitors.
Knowing your visitors' network ISP and providers helps you understand what type of content you need to have on your site. Each provider has its own connection speeds. For instance, if you see that many of your visitors have DSL, you must consider that they don't have fast upload speeds compared to cable companies. Some cable companies throttle streaming too. Companies such as Comcast are known to throttle video streaming, which means you need to offer slower video streaming options to optimize your media for your customers.
In addition to knowing your visitors' operating system and browser, you should also know if your primary traffic is on mobile devices. You identify mobile users in the "Mobile" section of the Analytics Audience reports. If you haven't made your site responsive, you're missing out on a growing trend on the Internet. Some experts estimate that mobile traffic will overtake desktop traffic in a few years.
It's important to understand if your customers are using mobile, because mobile sites must be coded, rendered and maintained differently. For instance, if you see that several mobile users open your ecommerce store and leave at the shopping cart, you could consider that one reason is the lack of mobile layouts. Mobile layouts use smaller images, less text and smaller screens. All of this can be done with CSS and HTML 5 but you need to create a design that caters to mobile users, especially if you notice that Analytics logs several mobile users.
Search engines also crawl and index mobile websites separate from desktop sites. When you have mobile viewers, you can create a separate site that search engines will use to send users. The result is better search engine visibility.
Another opportunity you can identify from mobile traffic is whether a mobile app could benefit your business. Most big ecommerce stores understand the importance of mobile app traffic. You give the app away for free, and you have your branded icon directly on a customer's tablet or smartphone. If you see that your website is visited by mobile devices frequently, you can use this information as a branding opportunity.
Filtering Data
When your site starts to rank in search engines and receives visibility, you can get a massive amount of traffic. If you run a business, your employees will use the business website to help customers and review information. You will also have a high amount of bot traffic. These traffic hits will skew your report numbers when you want to analyze true customer and visitor traffic. Google Analytics has the option to apply filters on your reports. These filters remove unwanted numbers that have an impact on your ROI or advertising goals. Analytics has some pre-defined filters you can use or you can build your own.
Note: Filters are only applied from the time you set them. This means that prior to setting your filters, the reports will include any traffic data on your site. Filters only work on reports from the time you set them until you remove them (if you ever do). When you analyze your traffic, take this into consideration when you have old reports before your filters were applied.
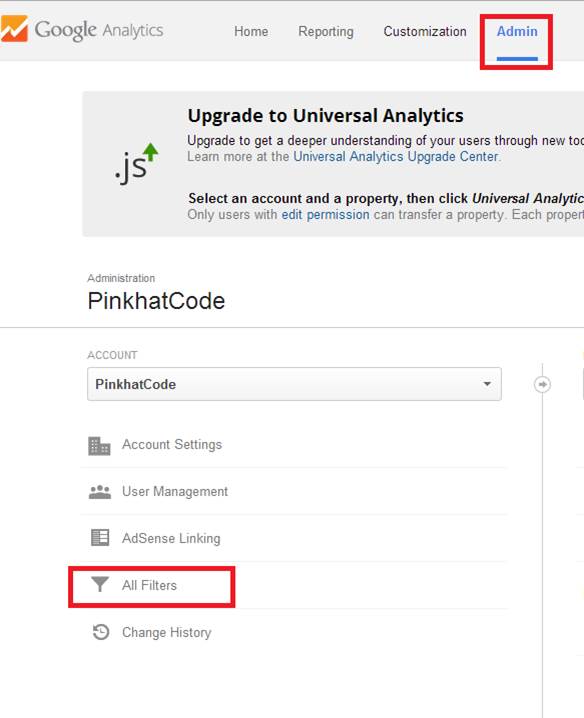
If this is the start of your Analytics account, you'll see no filters. Click "New Filter" to start the filter creation process.
Understanding Filters
Before you set up a filter, it's important to understand how they work. Even though you filter out data from your Analytics report, the data is still retrieved from your website. This means that when you remove a filter, the data is returned to your reports. When you create a filter, you won't ever see that data and Google removes it entirely from your reports.
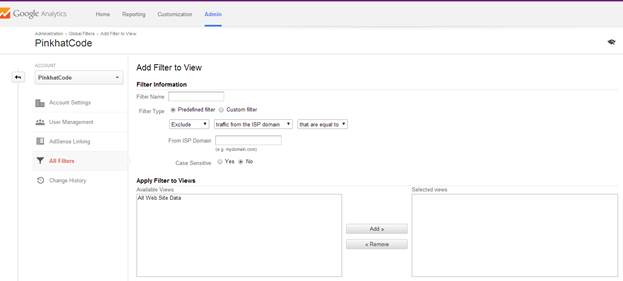
The first text box asks for a filter name. This can be any identifiable name that helps you find the filter in the future if you want to edit it.
The "Filter Type" can be predefined or a custom filter. Predefined filters are templates that Google has set up to make it easier for you to add it to your reports. For instance, most companies don't want to see traffic from their own business IP address, especially if you have hundreds of employees who use the site for customer service. You can use Google's predefined filters to remove traffic data from your business' IP address. You can also filter by ISP, host name and subdirectories.
Custom filters are more flexible, but you must know exactly what you want to filter out of your reports to make these filters effective. For instance, all URLs are case sensitive. When Google detects traffic to one page that's spelled "page.html," "Page.html," and "Page.HTML," all of these different cases are picked up as separate pageviews and sessions in Analytics. However, you probably don't want to count these different case spellings as different pageviews and sessions. To consolidate all three pages into one, you use a custom filter. Custom filters are more flexible but more advanced to set up properly.
Finally, your filters can be set to different web properties in your Analytics account. If you only have one website associated with your account, you can use the "All Web Site Data" view for your filters. However, if you work with multiple sites, you must choose each view from the list shown in the filter wizard.
Removing IP Addresses for Employees or Your Business
Filtering out IP addresses is part of the Analytics pre-defined filters. First, you need your IP address. Your IT person can tell you the external, public-facing IP address for your business or you can use sites such as whatismyip.com to view your IP. Remember, most businesses use a router that funnels all internal employee traffic to the Internet, so filtering this one IP blocks all employees on the network. Check with your IT person to find out if you have any other internal IP addresses you need to filter out.
Next, type the IP address into the "IP Address" text boxes. You can also filter out IPv6 IPs, which are commonly used by wireless devices.
Select a website or view and then click "Save." Repeat these steps to filter any additional IP addresses. From this point on, your company address will no longer be a part of your Google Analytics metrics.
This predefined filter is also useful for filtering out known bot IP addresses. The one issue with filtering bots is that you skew the traffic reports that include bot traffic. Only filter out bots if you use other reporting applications for crawling and bot statistics. Also, it can get tedious to find each bot IP address, and Google offers no complete list of bot IPs.
Filter Case Sensitivity
Case sensitivity is another common filter, but page case sensitivity must be set up using a custom filter. Setting up a filter for case sensitivity helps you understand how custom filters work.
First, go back to the filter section in the "Admin" section of Analytics and click "New Filter." Give your filter a name such as "Page case sensitivity" and select "Custom Filter" from the filter type options.
Choose "Lowercase" and then choose "Request URI" from the drop-down. Google displays information about regular expressions, which is the code used to identify the rule you set up for your filters. Select your view and then click "Save."
Custom filters have several other options. The way you use filters is dependent on how you want to manage the data Google Analytics stores. You can also search and replace values to consolidate them into one data point. For instance, click the "Search and Replace" filter option. Suppose you want to want to consolidate all article views into one data point, you can use the search and replace filter to find any instances of "article" in the URL and consolidate them.
You can also apply multiple filters to one website or view. It's important to note that filters are applied in the order that you place them on your views. A wrong order can create mistakes in your reports. For instance, suppose you only want to view data from the United States and Canada. If you apply one filter to only include the US and another filter to only include Canada, you will essentially filter out both. Why? Because the first filter will limit all traffic except for the US. Then, the second filter hits the data and only includes traffic from Canada. Since the first filter only allows US traffic, the second filter would have no Canada traffic to export. The result is no data at all. The answer to this problem is to create one filter that includes Canada and the US at the same time.
After you've created one filter, it's saved to your library, so you can reuse them with other websites in the future.