Key Terms
o Algebra
o Operation
o Variable
o Function
o Graph
Objectives
o Learn why an understanding of algebra is important
o Begin to acquire a grasp of the jargon associated with algebra
o Prepare to study the mathematical details of algebra
Operations
An operation in algebra is nothing more than a procedure performed on one or more numbers (or variables or functions). Multiplication, for instance, is an operation that is fundamentally performed on two numbers: for instance, 4 ![]() 3 is an example of a multiplication operation performed on the numbers 4 and 3.
3 is an example of a multiplication operation performed on the numbers 4 and 3.
Variables
One of the fundamental tools or concepts that we will regularly use in studying algebra is the variable, which is a symbol (typically a letter) that is used to represent a number. Instead of writing 2 + 9, we might write 2 + x, where x is a variable that does not have an as-yet specified value. The variable x could be 9, or it could be 2, or it could be any other number that you can think of. Nevertheless, the variable x acts in the exact same way as a number; thus, if x is equal to 9, then both 2 + 9 = 11 and 2 + x = 11. In addition, all the rules associated with arithmetic operations such as 2 + 9 also apply when variables are used. For example, 2 + x = x + 2. Variables can be used in cases where a number is too long to write out (such as a repeating decimal), or it can be used where a particular value is unknown or otherwise unspecified.
Practice Problem: Use variables to write an expression for the final cost of an item given an unspecified base price and a sales tax rate of 5%.
Solution: We know that the final cost of an item is its base price plus its price multiplied by the sales tax rate. For example, if an item costs $30, then the final cost is
![]()
We can write a general expression for this operation using a variable in place of the price, however. Let's use the variable p to represent the price of an item. In the example above, we used the example of $30--in this case, however, we don't know what the price is, so let's simply substitute p for the price.
![]()
Note that this is a general expression: it works no matter what the price is. For example, if the price is $20.37, just substitute $20.37 for p. This example illustrates how we can write a general algebraic expression for a mathematical operation.
Functions
A relation between a given set of numbers and variables is a function. A function, like a variable, is often assigned a symbol: for obvious reasons, f is often a letter of choice for a function (but other choices are also legitimate, depending on the details of the problem). The function symbol is then typically followed by parentheses that contain the variables used in the expression. Following the example of the above practice problem, we can define a function f that converts the price p of an item into its final cost that includes sales tax. We would write the function as follows.
![]()
When you choose a value for the variable, simply substitute the value for every instance of the variable in the function. Thus, if an item is priced at $60, then its final cost is f($60), or
![]()
Practice Problem: Write a function for the area of a rectangle with one known side of length 10.
Solution: Let's start by drawing a diagram of the rectangle described in the problem.
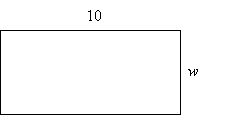

The diagram shows the known side (of length 10) and the unknown side, whose length we can call w, since it is unknown. We know that the area of a rectangle is the product of the length and the width, so let's define a function A(w) that is the area of the rectangle in terms of the unknown width variable w. The full expression, and the solution to the problem, is then the following:
![]()
Graphs
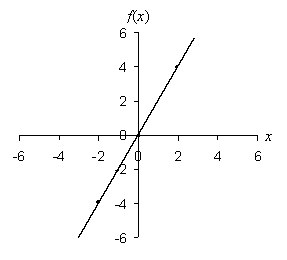
A particularly helpful tool in studying algebra is the graph. The term graph can have a range of meanings depending on the context, but in algebra, a graph is usually meant as a coordinate graph. A graph shows the value of a function (typically in the vertical direction) with respect to a range of values for a variable (typically in the horizontal direction).
Practice Problem: Draw the graph of the function f(x) = 2x.
Solution: This function simply involves doubling of the value of the variable. First, let's draw a set of coordinate axes, with the vertical axis corresponding to f(x) and the horizontal axis corresponding to x. Also, label the axes with evenly spaced tick marks (as you might see on a ruler). Finally, select some values for x, calculate f(x), and draw the corresponding points on the graph. If you connect these points, you will then have the graph of the function.
