Data is one of the most important aspects of Visio 2016. Without the data capabilities that the program contains, it would be nothing more than an overdressed SmartArt or chart creation program like you see in other Office programs such as Word.
While it's true that Visio 2016 gives you all the tools you need to create all types of drawings, then customize the look and feel of each, the true benefit if Visio lies in the data tools that it provides. Flowcharts and diagrams are only mere drawings without data to back them up, and Visio gives you all the methods that you need to incorporate and link to that data.
Shape Data
Chances are if this is your first time learning Visio, but you've used SmartArt in a program like Microsoft Word before, you're thinking that Visio has more bells and whistles� but is basically the same thing. If you thought that, you couldn't be more wrong.
Although the SmartArt feature in programs such as Word give you the ability to create diagrams, they are basic and nothing more than illustrations. They contain illustrations of data, but they do not contain data.
Visio offers illustrations, but also data. In fact, part of what makes Visio so unique is that the data resides in the very shapes that you drag onto your screen.
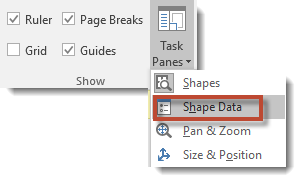
To see the data for a shape, select the shape, then go to the View tab. Click the Task Panes dropdown in the Show group.
Select Shape Data.
We've selected our tablet device.
As you can see, a box appears next to your page in the Drawing window.
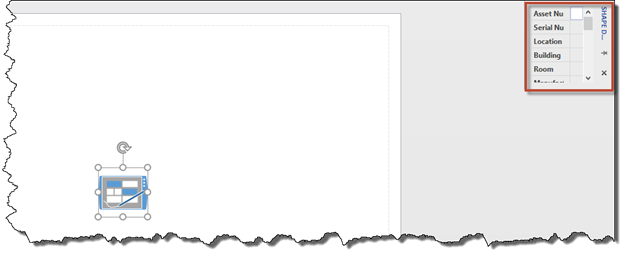
If the tablet PC shape we dragged onto our page actually represented a physical tablet PC, we could enter the data related to that tablet device, such as the serial number, CPU, memory, etc. That data would be stored with the shape.
Below are all the fields for shape data related to the tablet device.
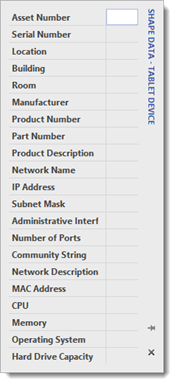
You enter data about whatever the shape represents.
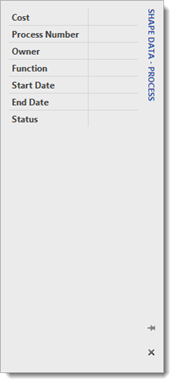
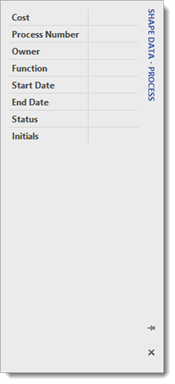
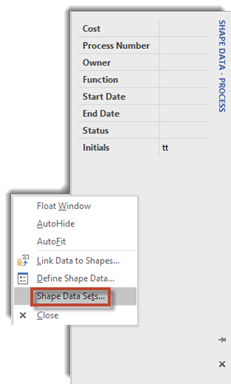
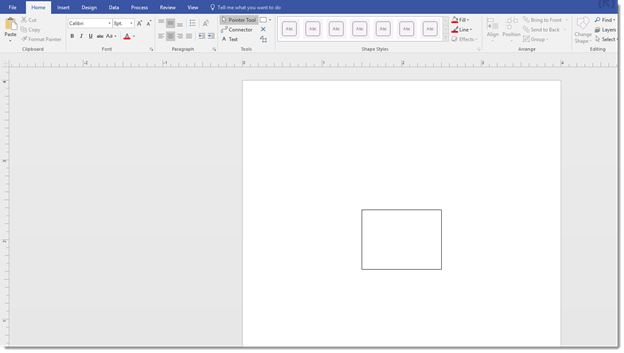
Here is the shape data for a process using the Basic Flowchart template.
Types of Shape Data
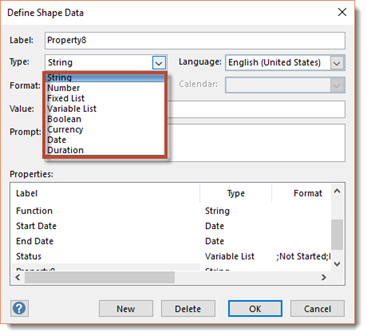
Shape data is data that describes properties of your shape. There are eight types of shape Data in Visio 2016. These are:
-
String, which is free form text.
-
Number, which is numeric data.
-
Fixed List, which is a dropdown list that allows viewers to choose an option.
-
Variable List, a dropdown list that allows viewers to choose an option or add some of their own by filling out a text box.
-
Duration, which is time expressed in either seconds (es.), minutes (em.), hours (eh.), days (ed.), or weeks (ew.).
-
Date, which is a calendar date.
-
Currency, which is money units based on the user's region and language (in Windows).
-
Boolean, which is true or false.
Inserting a Shape Data Field for a Shape
Visio provides default data fields for each shape, as we saw in the last section. For example, the fields for a process are Cost, Process Number, Owner, Function, etc.
However, you can also add fields if there is more data you need to include. For example, perhaps you want to add a field for whoever enters the shape data to also enter their initials.
Start by selecting the shape.
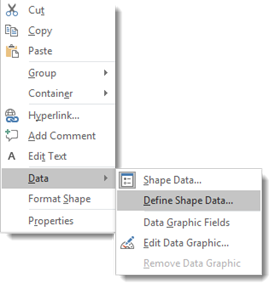
Right click on it to see the context menu.
Click Data, then Define Shape Data.
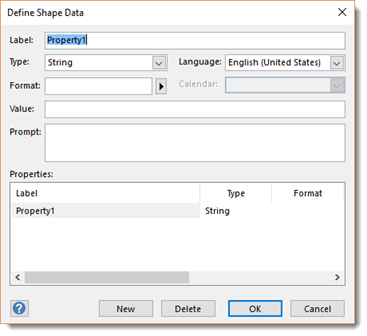
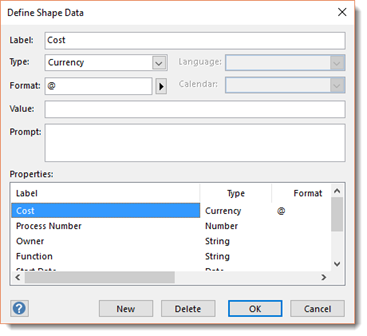
You will then see the Define Shape Data dialogue box.

To add a new field, click the New button.
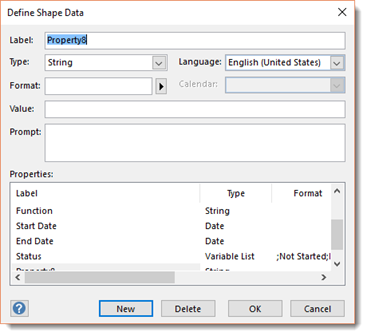
In the Label field, enter the data label. This will remind you what type of data to enter. We're going to enter Initials.
In the Type field, enter the data type.
You can enter information into any of the other fields as well.
The fields you'll find in the Define Shape Data dialogue box are:
-
Label is field name.
-
Type is one of the eight data types we discussed earlier in this article.
-
Format will dtermine how data will be presented.
-
Value is the value entered when a shape was defined.
-
Prompt is a tooltip that appears when the mouse is over the shape.
When you're finished, click OK.
As you can see in the snapshot above, our new field is added.
Creating Reusable Data Field Sets
You can also create a data field that will apply to all selected shapes in your drawing. This means you can create a new data field for a process shape that will apply to all selected process shapes.
To do this, go to the View tab. Click the Task Panes dropdown in the Show group, then click Shape Data.
You will then see the Shape Data pane in your Drawing window.
Right click in the Shape Data pane, and select Shape Data Sets.
You will then see the Shape Data task pane appear over the Shape Data pane.
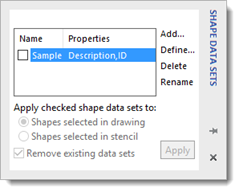
Click Add.
You will then see the Add Shape Data set dialogue box.
Next, type a name for the data set.
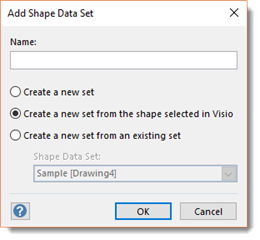
Put a check beside "Create a new set".
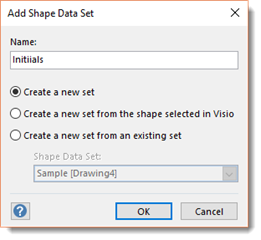
Click OK.
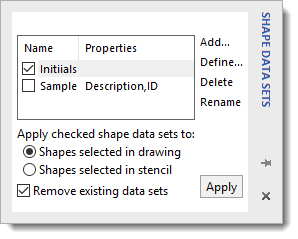
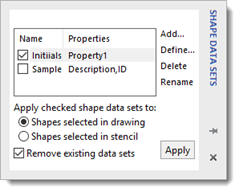
Put a checkmark beside the data set you've just created, as we've done in the snapshot above.
Click Define.
You will then see the Define Shape Data dialogue box.
Define your data fields as you learned to do in the last section, then click OK.
In the Shape Data Sets task pane, click Apply.
Adding Data Fields to Master Shapes
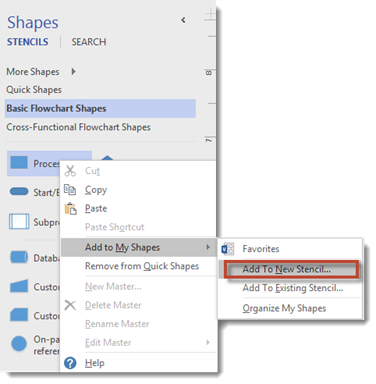
If you want a data field to appear in shape data whenever you use the shape, you can simply add it to the master shape. For example, if you want the Initials field to appear whenever you drag a process shape onto your drawing, you would add the field to the master shape in the Shapes window.
To do this, go to the Shapes window. Right click on the shape and click Add to My Shapes, then Add to New Stencil.
You'll then see the Save As dialogue box.
Type in a name for the new stencil in the Save As field.
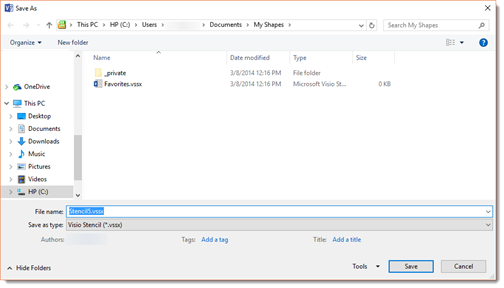
We are going to name ours "Example".
Click the Save button.
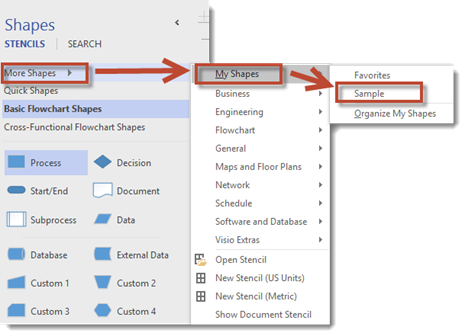
Go to the Shapes window.
Select More Shapes, then My Shapes, then your new stencil.
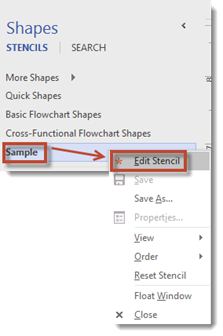
Right click on the name of your new stencil, then click Edit Stencil.
Now right click on the stencil. Click Edit Master, then Edit Master Shape.
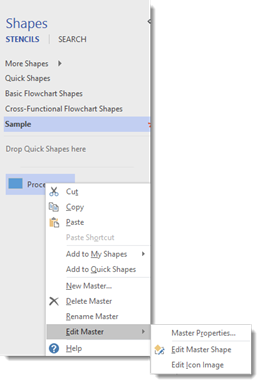
You will then see that shape's edit window.
NOTE: While in the edit window, you can change the shape's color. To change the color, go to the Home tab, then either change the line or fill color.
Select the shape, then right click on it.
Select Data, then Define Data Shape from the context menu.
Follow the steps we learned earlier in this article to create a data label.
We are going to create Initials again.
Click the OK button when you're finished.
Next, go to the View tab to close the edit window.
Go to the Windows group, then click Cascade.
Select the window for the master shape and click the X in the upper right hand corner of the edit window to close it.
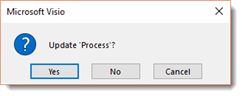
Visio will then ask if you want to update the shape. Click the Yes button.
Finally, go back to the Shapes window. Right click on the stencil's name, then click Save.
Whenever you drag that shape onto your drawing, the data field you added will appear.
Adding Shape Data to a Shape on Your Drawing
You can have any of the shape data appear with your shape in the Drawing window. For example, we can have the data in the Initials field appear with our shape in the Drawing window.
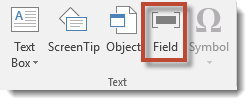
To do this, go to the Insert tab. Click the Field button in the Text group.
You will see the Field dialogue box.
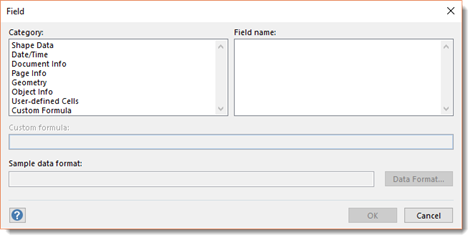
Select Shape Data from the Category section of the dialogue box.
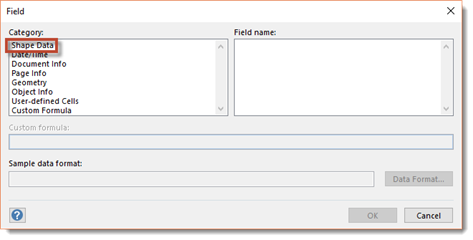
You'll see the fields appear in the Field Name section.
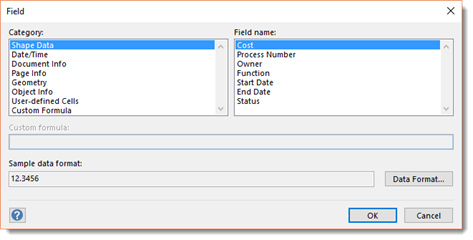
These are the fields that appeared in the Shape Data window. Select the field for the data that you want to appear, then click OK.
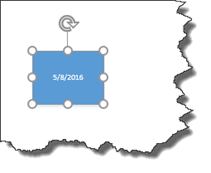
We've chosen Start Date.
As you can see, the start date we entered into for this shape now appears on it. We can then format the text.
Continuing to Work with Shape Data
You've already learned how to manually enter shape data in Visio 2016. However, you can also link to data from external sources, such as a spreadsheet, database, or other source.
Linking Diagrams to External Sources
While data linking to external sources was complicated and confusing with prior versions of Visio, Visio 2016 makes it a lot easier. All you have to do is link the diagram to a data source, then link the individual shapes to the data.
Let's learn how to do this.
First, go to Data tab, then click Advanced Data Graphics dropdown in the Advanced Data Linking group.
The dropdown looks like this:
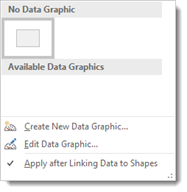
Remove the checkmark that comes before "Apply after Linking Data to Shapes."
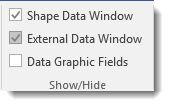
Next, go to the Show/Hide group under the Data tab.
Put a checkmark beside External Data Window.
You will then see the External Data Window open on the right side of the Visio screen.
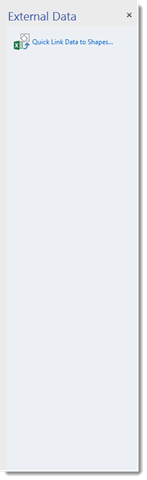
Click "Quick Link Data to Shapes".
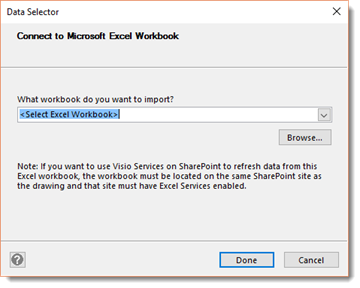
Locate the data file on your PC by clicking the Browse button.
When you're finished, click the Done button.
You will then see this dialogue box:

Click the Done button.
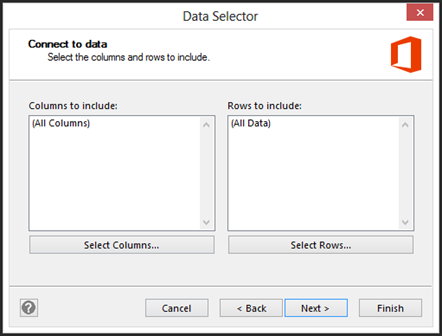
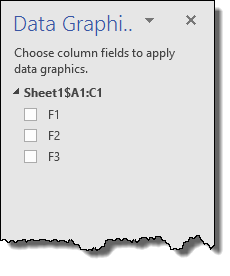
As shown in the snapshot above, you'll next be asked to specify what column fields you want to apply to the data graphic.
If you update the data in the external source, the data in your diagram can also be refreshed. Visio 2016 asks you to choose how you want to identify changes in the data.
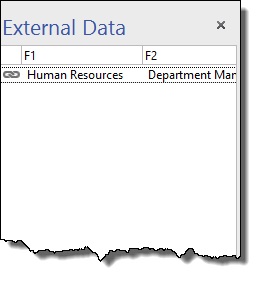
You'll then see the data in the External Data window to the right of our drawing.
Drag a row of data to a shape to link the data to that shape.
Quick Import
New to Visio 2016, Quick Import lets you connect to data in Excel spreadsheet in just one step.
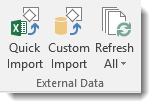
To use Quick Import, go to the Data tab.
Click the Quick Import button in the External Data group.
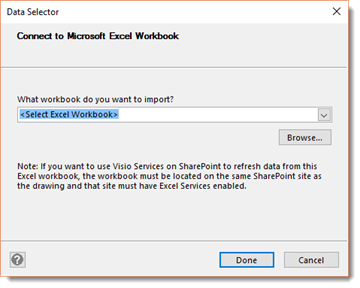
Click the Browse button to select the workbook you want to import, then click the Done button.
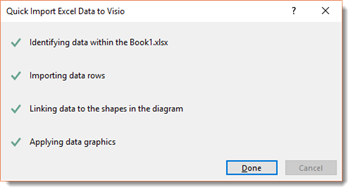
When the data is imported, you'll see the dialogue box pictured above.
Click Done again.
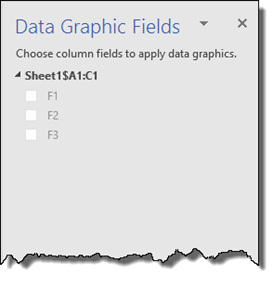
You can then go to the Data Graphics Fields pane to select the column fields you want to apply.
If you update the data in the external source, the data in your diagram can also be refreshed. Visio 2016 asks you to choose how you want to identify changes in the data.
You'll then see the data in the External Data window to the right of our drawing.
Drag a row of data to a shape to link the data to that shape.
Refreshing Linked Data
Once you have data linked to an outside source, you need a way to refresh that data to reflect additions, subtractions, or changes.
The first step in doing this is making the changes in the external data source, then saving those changes. Using the example above, we would make changes to our Excel workbook.
Next, go to Visio, then Data tab, then the Refresh All button in the External Data group.
Click the button and not the downward arrow for Refresh All. Visio will then look at the data from the lined source. You'll see the results in the Refresh Data dialogue box.
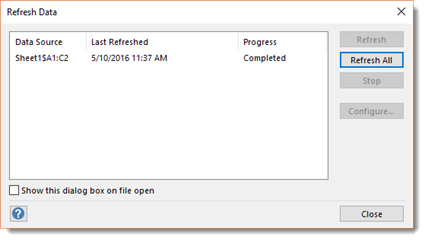
Click Close.
Linking Data to Shapes
Earlier in this section, we talked about linking diagrams to external data. Now we're going to learn how to link data to shapes.
For this example, we're going to use the process map shown below:
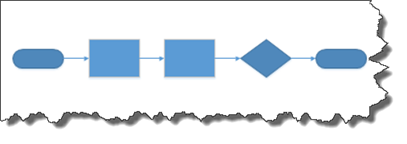
We're going to assign sequential numbers to each process shape. We're going to assign 12 to the first process shape in the Process Number field (go to shape data to do this). We're going to assign 13 to the second process shape.
Next, make sure that your diagram is linked to external data using the steps you learned earlier in this section.
Go to Data, then click Link Data in the Advanced Data Linking group.
You will then see the wizard.
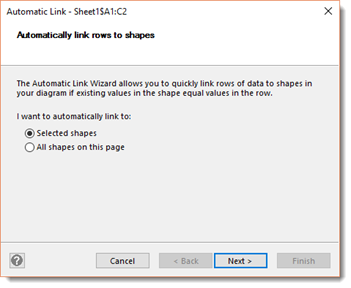
We are going to select All Shapes on this Page.
Click Next.
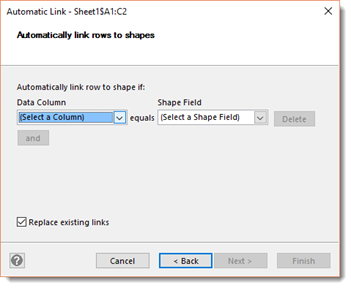
Go to the Data Column section. Click Process Number.
In the Shape Field, click Process Number.
Click Next.
You will then see a summary of your choices in the final window.
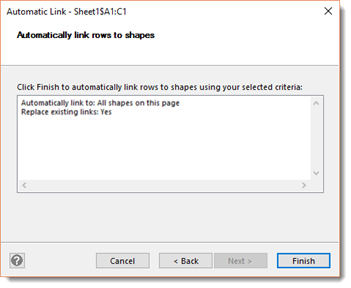
Click Finish.
Creating Predefined Reports
Now that you've entered data into your drawings, you'll want to be able to view that data when you need it. You can do so by running reports.
To run a predefined Visio report, go to Review tab, then click Shape Reports button in the Reports group.
You will then see the Reports dialogue box.
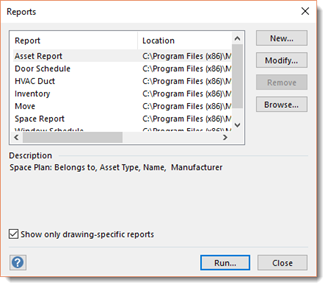
We are going to click on the Asset Report to select it.
Click Run.
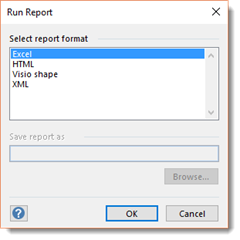
Choose the format for viewing your report.
-
Excel. The report will be presented in Excel.
-
HTML. The report will be presented in Internet Explorer. However, it will be read only.
-
Visio Shape. A new shape will be created to hold your report data. The shape is an embedded Excel object.
-
XML. The report will be presented in an SML file.
For this example, let's choose Excel.
Click OK.
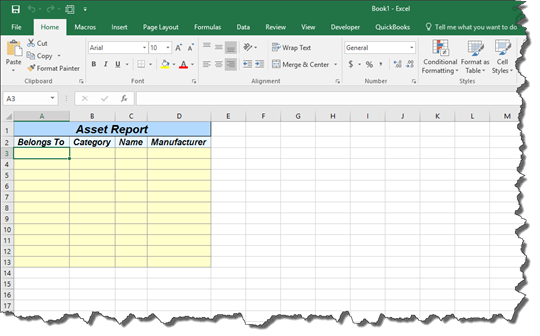
This is a flowchart report. An inventory report will count the occurrences of every shape on a page.
Creating New Reports
You can also create your own reports.
Let's learn how to do this.
Go to Review tab, then click Shape Reports button again.

Click the New button.
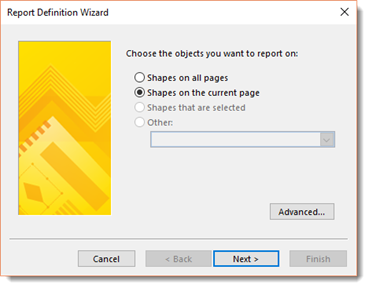
Select Shapes on the Current Page.
Click Next.
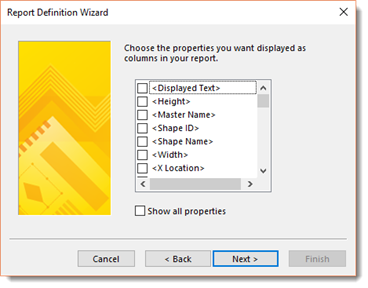
Choose the data you want displayed in the report.
Click Next.
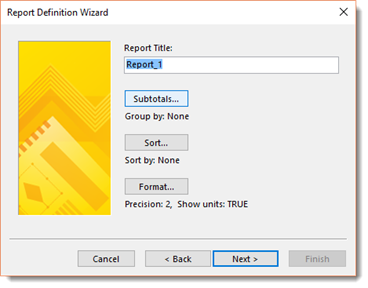
Enter a name for your report in the Report Title field.
Click Sort to determine the order of the data in your report.
You will then see the Sort dialogue box.
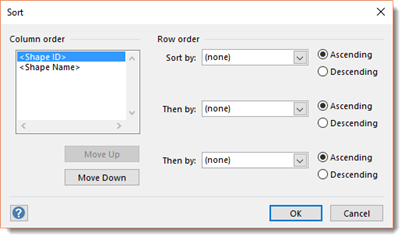
Choose how you want your data sorted, then click OK.
Click Next in the Report Definition dialogue box.
You will see this window:
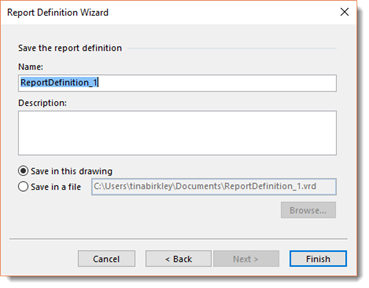
You can now choose to save the report in the drawing or in a file.
Click Finish.
In the Reports dialogue box, click Run.
Choose your report format, then click OK.
Creating a Hyperlink to a Website
As well as linking to data, you can also link to websites and documents. We'll learn how to create hyperlinks to documents in the next section. For now, let's focus on hyperlinks to websites.
To create a hyperlink to a website, start out by selecting a shape in your drawing.
Next, right click on the shape and click Hyperlink.
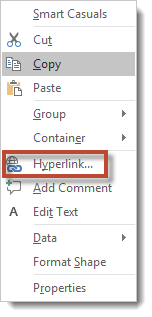
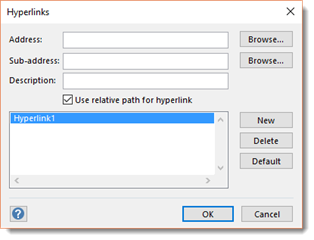
You will then see the Hyperlink dialogue box.

Click the top Browse button beside the Address field. You'll see a menu like the one pictured below.
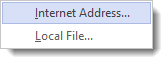
Select Internet Address.
A web browser will open for you. This will be your default web browser such as Microsoft Edge, Google Chrome, etc. Go to the web page you want to link to. You can copy its URL and paste it into the Address field.
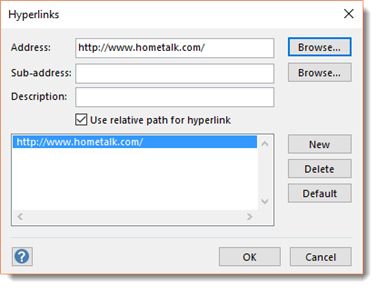
Click OK.
Creating a Hyperlink to a Document
You follow the same beginning steps to create a hyperlink to a document as you did when we created a hyperlink to a webpage.
Right click on a shape in your drawing and select Hyperlink.
Click the top Browse button to the right of the Address field to see this menu.
Select Local File.
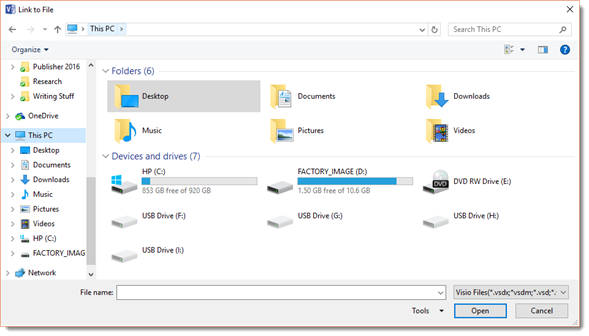
Locate the document in your files, then click Open and find the file.
As you can see in the snapshot above, the file type is set to Visio Files.
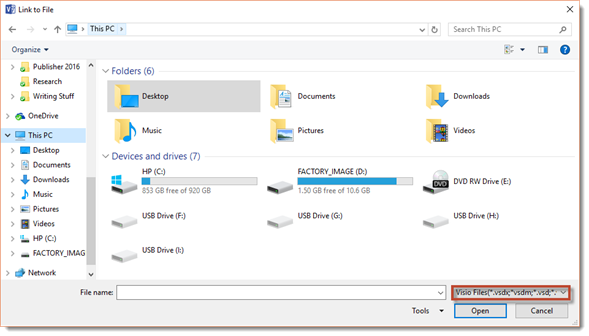
Click the downward arrow to look for other file types.
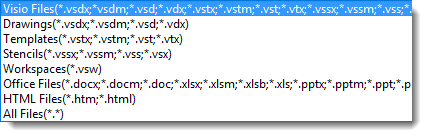
We have chosen All Files.
Now, find the file you want on your computer.
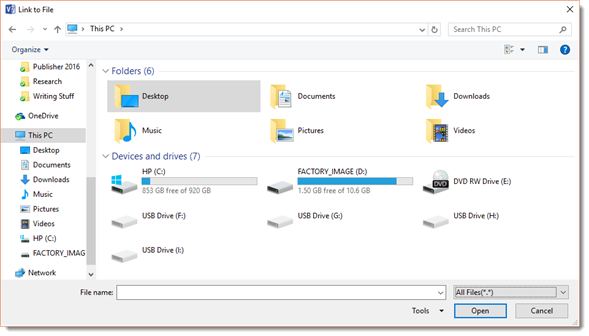
Click on the file once to select it, then click Open.
Click OK in the Hyperlink dialogue box.
 and instructions to click on the link.