In this article, we begin to learn how to organize and analyze data sets. In particular, we look at cross tabulations, which are a convenient way to aggregate certain types of multivariate data sets. To provide a foundation for analyzing cross tabulations, we also review the procedure of statistical hypothesis testing.
Key Terms
o Cross tabulation
o Contingency table
o Statistical hypothesis testing
o Statistical hypothesis
o Null hypothesis
o Alternative hypothesis
o Significance level
o Test statistic
o Critical value
Objectives
o Create cross tabulations for bivariate data sets
o Review the basic terminology and procedure associated with statistical hypothesis testing
Let's Begin!
Earlier, we introduced multivariate data as well as several methods of displaying and quantifying such data, including tables, matrices, scatterplots, and descriptive statistics. We now turn to methods for analyzing multivariate data for relationships between the variables; in this article, we introduce cross tabulations, and later, we will look at regression analysis. Table representations (and matrices, to some extent) are amenable to analysis through cross tabulation, whereas scatterplots can benefit most directly from regression analysis. To be sure, table and scatterplot representations of a data set do not change the data, but one representation may help us better interpret or view a certain type of analysis. Following our brief introduction to cross tabulation, we turn to a review of statistical hypothesis testing to set the stage for analyzing cross tabulations.
Cross Tabulations
A cross tabulation (sometimes known as a contingency table) relates data expressed in multiple variables. Relying on bivariate data (for simplicity) with variables X and Y, a cross tabulation would relate X values to corresponding Y values. The best way to illustrate cross tabulation is through example; let's start with a simple one. Assume a statistician is examining a group of individuals, male and female, in an attempt to determine if gender is related to "handedness" (i.e., being right or left handed). A data set expressed in table form might look like the following. (Note that M and F are used for male and female, respectively, and L and R are used for left and right handedness, respectively.)
Gender |
Handedness |
|
M |
L |
|
F |
R |
|
M |
R |
|
M |
R |
|
F |
L |
|
M |
R |
|
F |
R |
|
F |
L |
|
M |
L |
|
F |
R |
|
F |
R |
Assessing these data in the form shown above is obviously difficult, even though it includes only 11 data pairs; a real data set might include many times this number. Thus, we use a cross tabulation to organize the data in a more concise table. We can select gender (M and F) to represent the rows and handedness (L and R) to label the columns of the table. In the table, we enter the number of instances in which a male is left handed, and so on. We can also add a "total" row and column. The cross tabulation is shown below.
|
|
Handedness |
|||
|
L |
R |
Total |
||
|
Gender
|
M |
2 |
3 |
5 |
|
F |
2 |
4 |
6 |
|
|
Total |
4 |
7 |
11 |
|
Note that a cross tabulation can reduce a very large data set to just a few rows and columns (the exact number depends, of course, on the number of possible values that each variable can take).
Practice Problem: A certain casino game involves numbers between 1 and 16 that each have an associated color (red or black). Create a cross tabulation for the numbers, consolidating the data according to evenness/oddness and color (red/black). (Note that 'R' stands for red and 'B' for black.)
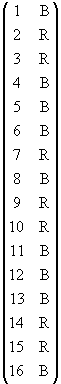
Solution: To create the cross tabulation, draw a table with row headings of "even" and "odd" and column headings of "red" and "black"; also include a row and column for the totals. If necessary, divide the data set into its even numbers (2, 4, 6, and so on) and odd numbers (1, 3, 5, and so on) to simplify the tabulation.
|
|
Color |
|||
|
Red |
Black |
Total |
||
|
Even/Odd
|
Even |
3 |
5 |
8 |
|
Odd |
4 |
4 |
8 |
|
|
Total |
7 |
9 |
16 |
|
Notice that, as expected, half the numbers are even and half are odd, but the color distribution is skewed slightly.
Overview of Hypothesis Testing
Before we can analyze cross tabulations, we must acquire a certain level of understanding of the process of statistical hypothesis testing (or simply hypothesis testing), which is a method of determining whether a specified proposition about a statistical data set (i.e., a statistical hypothesis) can be accepted (to within a certain probability). For instance, given a variable X, a simple statistical hypothesis that we may wish to test is "the mean of the distribution of X is a." Our statistical hypothesis may, of course, be more complicated.
When performing hypothesis testing, we start by making the assumption that our statistical hypothesis is true-the hypothesis is then called the null hypothesis. The negation of the null hypothesis is often called the alternative hypothesis. On the assumption that the null hypothesis is true, we then wish to perform a statistical analysis that allows us to either reject or not reject the null hypothesis. (Note that we speak of rejecting and not rejecting the null hypothesis rather than rejecting and accepting it, since the null hypothesis is assumed to be true at the outset of the investigation. Analysis through hypothesis testing allows us to determine whether the assumption is warranted on the basis of the available data.)
We will generally label the null hypothesis H0 and the alternative hypothesis Ha. When performing hypothesis testing, we must choose a significance level (often represented using the symbol α), which is an arbitrary measure of statistically significant deviation of a statistical value from an assumed value. We can then calculate a so-called test statistic that adequately characterizes the data under evaluation. If this test statistic exceeds the critical value associated with our pre-chosen significance level, then we conclude that the null hypothesis must be rejected. Otherwise, we do not reject the null hypothesis. (In other words, if the test statistic deviates from our assumption in a statistically significant manner, then we must reject the assumption.)
We can summarize the process of hypothesis testing as follows. This procedure is only for the purposes of illustrating the logic of hypothesis testing; In the next article, we will apply this logic to cross tabulations.
1. Formulate the null hypothesis, H0, and the alternative hypothesis, Ha, for the problem.
2. Select a significance level, α, that defines the measure of a statistically significant deviation. (Typical values for α are 0.01 and 0.05.)
3. Choose an appropriate test statistic for evaluating the hypothesis.
4. Calculate the critical value, c, according to the test statistic and the significance level, α.
5. Evaluate the data for the random variable and determine if it exceeds the critical value, c, for the test statistic. If so, then the null hypothesis should be rejected; if not, then the null hypothesis should not be rejected.
Practice Problem: A statistician has created the cross tabulation below using data collected in a random survey. If she wants to determine whether a relationship exists between gender and handedness, what would be an appropriate null hypothesis for performing a statistical hypothesis test?
|
|
Handedness |
|||
|
L |
R |
Total |
||
|
Gender
|
M |
1,034 |
5,942 |
6,976 |
|
F |
957 |
5,382 |
6,339 |
|
|
Total |
1,991 |
11,324 |
13,315 |
|
Solution: Although several different possible hypotheses might be valid, a good choice for the null hypothesis (H0) would be "Handedness is not related to gender." (Of course, the specific language used to express this hypothesis might vary as well.) In this case, the statistician might well expect that the ratio of left- to right-handed males should be the same as the ratio of left- to right-handed females. The numbers in the cross tabulation would then give her a basis for performing a statistical test of the null hypothesis.