Key Terms
o Linear inequality
o Solution set
Objectives
o Learn how to graph linear inequalities
o Understand how the rules for manipulating linear inequalities differ from those for linear equations
o Be able to solve linear inequalities
Linear Inequalities
A linear inequality involves the relationship between linear functions, just as do linear equations. The difference, however, is that linear inequalities relate two linear functions using the symbols <, ≤, >, or ≥, which correspond respectively to less than, less than or equal to, greater than, and greater than or equal to. Because these relationships do not involve a strict equality, solutions for expressions that contain them are more complex than similar expressions that do involve strict equality. For the most part, the same rules we have used for linear equations also apply to linear inequalities-a few nuances must be considered, however.
Let's consider a simple linear inequality: f(x) > 2x – 1. This expression simply means that the output of the function f are those values that are greater than 2x – 1. Let's look at this inequality graphically--first, we must plot the line 2x – 1, which is the boundary between values that satisfy the inequality and those that do not.
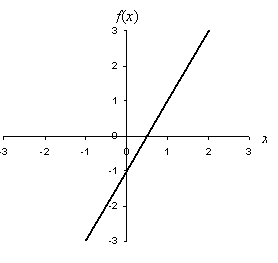

The line in the above graph defines the function (or equation) f(x) = 2x – 1; what we want to find, however, is f(x) > 2x – 1. This is to say, the values of f(x) that satisfy this inequality are those that are larger than those corresponding to the expression 2x - 1. Since f(x) and 2x – 1 are both sets of values along the vertical axis, the plot of f(x) > 2x – 1 must be all values above the line, but not including the line. (If the expression was f(x) ≥ 2x – 1, then the graph would include the line.) To display this set of values for f(x) on the graph, we shade the region above the line, but we make the line broken to indicate that the line is not part of the region that satisfies the expression f(x) > 2x – 1.
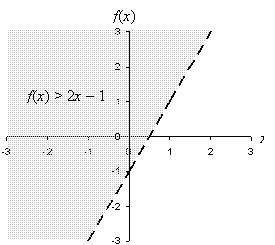

If the inequality was f(x) < 2x – 1 or f(x) ≤ 2x – 1, then the region below the line 2x – 1 would be shaded (and the line would or would not be solid depending on which expression was used).
Practice Problem: Graph the inequality k(z) ≤ –z + 4.
Solution: First, let's draw an appropriate set of axes and graph the line –z + 4. We'll use a solid line because the line itself is part of the solution set (since ≤ is used). Next, we'll shade the area below the line. The result should look like the following graph.
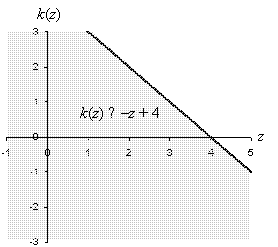

We can perform a "necessary but not sufficient" check of the result to give us more confidence in this answer: pick any point in the shaded region and use those values to see if the inequality holds for that point. Let's try the point (4, 0):
–z + 4 = –4 + 4 = 0
k(4) = 0 ≤ 0 Inequality holds
If the linear inequality is expressed entirely in terms of the independent variable, then the solution is all values on one side or the other of some vertical line x = c, where c is some constant. For instance, let's look at the inequality –7x – 5 ≤ –2 + x. We can manipulate inequalities using the same rules of algebra we apply to algebraic equations. There is one difference, however: if both sides of an inequality are multiplied by a negative number, you must reverse the direction of the inequality. We can see this with simple numbers: 4 < 6, yet –4 > –6. Let's express this rule generally for functions f(x) and g(x) and a constant value –c (where c > 0):
f(x) < g(x) → –cf(x) > –cg(x)
f(x) > g(x) → –cf(x) < –cg(x)
f(x) ≤ g(x) → –cf(x) ≥ –cg(x)
f(x) ≥ g(x) → –cf(x) ≤ –cg(x)
Now, let's return to our example.
–7x – 5 ≤ –2 + x
–7x – 5 – x ≤ –2 + x – x
–8x – 5 ≤ –2
–8x – 5 + 5 ≤ –2 + 5
–8x ≤ 3
Now, recall the new rule:
–8x ≤ 3
![]() (-8x) ≥
(-8x) ≥ ![]() (3)
(3)
x ≥ ![]()
This is the solution to the inequality. Note, however, that this is a range of values, not just a single value. We call the set of solutions to an equation or inequality the solution set. Let's take a graphical look at the solution set for this inequality. Note that because our solution involves only the independent variable, we can plot the results using a number line instead of a planar graph. When doing so, use an open circle (![]()
![]() ) if the endpoint of the solution set is not included, and use a closed circle (
) if the endpoint of the solution set is not included, and use a closed circle (![]()
![]() ) if it is included. We use an arrow (a ray) to indicate the solution set.
) if it is included. We use an arrow (a ray) to indicate the solution set.


Note that we use a solid line because the inequality is of the form "greater than or equal to." The shaded region in the graph, including the solid line, is the solution set of the inequality –7x – 5 ≤ –2 + x.
Practice Problem: Find and graph the solution set of 3x – 4 < 1 – x.
Solution: First, we can manipulate the inequality to find a corresponding solution set in terms of the independent variable x.
3x – 4 < 1 – x
3x – 4 + 4 < 1 – x + 4
3x < 5 – x
3x + x < 5 – x + x
4x < 5
x < 5/4
We can check this result by using a value that satisfies x < 5/4; let's try x = 0.
3(0) – 4 < 1 – (0)
–4 < 1 Inequality holds
Now, let's graph the result. Note that we use an open circle at x = 5/4 because the solution set is a strict inequality (the < symbol is used).


