Learn what a baseline is and how to use it in Project. By definition, a baseline is the detailed project against which actual work is tracked. It is kind of like detailed plans for your new home before you ever start to build it. It tells you how your house is going to look, what supplies you are going to need, and gives you an estimate of how much it is all going to cost - before any work is actually started. A baseline in Project is saved in your Project file. It exists alongside any activity that goes on with your tasks.
A baseline is helpful to you for several reasons. You can use your baseline and the actual activity to explain delays or going over budget. It helps you track where and when you wanted to go when you started the project with where you are actually going. It also helps you see how close to schedule you are keeping.
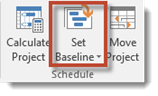
You can save a baseline at any time by going to the Set Baseline dialogue box. Go to Project tab. From the Set Baseline button's dropdown menu, select Set Baseline.
Now you can see the dialogue box.
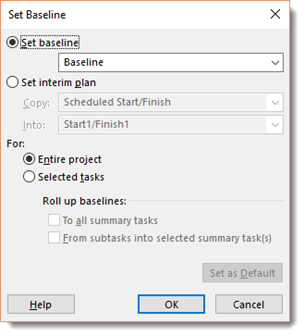
Now you can select the entire project or just select tasks by clicking a radio box in the For section.
If you choose Selected Tasks, select how the baseline rolls up (or summarizes) changes made to task data.
You can also clear and reset baselines if plans, costs, or anything else related to the project changes. If you want to clear the baseline for certain tasks, select them, then go to the Project tab.
Click the downward arrow for the Set Baseline button again.
Select Clear Baseline.
You will then see the Clear Baseline dialogue box:
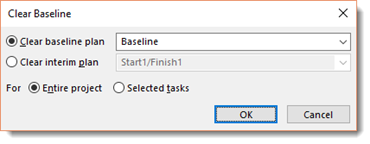
Select if you want to clear the baseline for the Entire Project or Selected Tasks. For this example, we are going to use Selected Tasks because we've already said to select those tasks. If you wanted to clear the baseline for the entire project, you simply wouldn't select tasks.
Next, from the Clear Baseline list, select the baseline that you want to clear.
Interim plans are like mini-baselines. They only save the timing information and not resource assignments, costs, etc. And this is only for tasks that have activity tracked on them as well as baseline start and finish dates for all tasks that haven't yet started. An interim plan is a lot smaller of a file than a baseline. It is helpful to use to record date changes, but not overwrite original baseline cost data.
You save interim plans using the same dialogue box that you used to set your baseline.
However, instead of checking Set Baseline, you will check Set Interim Plan.
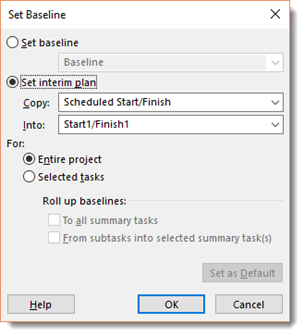
Next, use the dropdown box to select the data to copy to the interim plan, then where you want to copy it into.
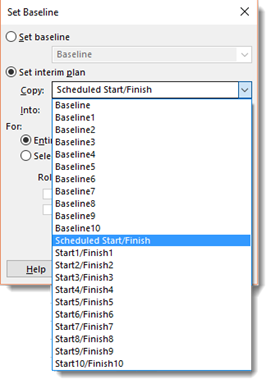
Select if you want to save interim plans for the entire project or selected tasks. If you choose to save for selected tasks, make sure you select how you want to roll up the baselines.
You can also clear and reset interim plans just as you did baselines. If you want to clear interim plans go to the Project tab.
Click the downward arrow for the Set Baseline button again.
Select Clear Baseline.
You will then see the Clear Baseline dialogue box:
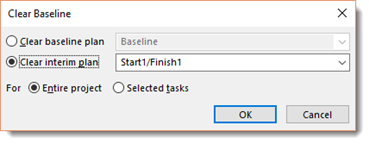
Put a checkmark to the left of "Clear Interim Plan".
Next, from the Clear Interim Plan dropdown menu, select the interim plan that you want to clear.
Select if you want to clear the interim plan for the Entire Project or Selected Tasks.
Sometimes even the best laid plans go awry. Maybe you are suddenly over budget or you are going to miss a very important deadline. Perhaps you have a basic idea of what went wrong because you've been managing every aspect and communicating with everyone on your team. But still, you need to be able to explain to the powers-that-be what went wrong and justify whatever occurred. Then, you have to fix it to save your project and maybe even your job.
If you've kept interim plans, baselines, and task notes, then it is going to be much easier to show where things got off track and explain exactly what went wrong. Your interim plans and baselines will show where you got off track and why. They'll also show adjustments that you made to get past major problems. You will also be able to show your boss that you were managing things all along and that the major problem is not because of lack of management.
To view your baseline and interim plans, go to Gantt Chart view.
Right click the column heading area of the sheet pane, then select Insert Column.
The new column is inserted.
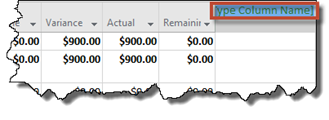
As you can see, you do not have to choose a column from the dropdown list. Instead, you can now name the column where it says "Type Column Name."
You might choose Start 1-10 and Finish 1-10 for an interim plan or Baseline 10 for baseline.
Repeat these steps for additional columns. Your task notes should tell you about resources assigned to a task, vendor problems, as well as late deliveries. You can also use these notes to show what went wrong and to explain why.
Here are other things you can do to troubleshoot and possibly fix problems in the project:
- Resource leveling. This can solve conflicts with resources that may be holding up progress on your project.
- Cut costs. You can sort tasks by cost. Concentrate on the higher cost tasks and trim things that are nice, but you really do not need.
- Delete Tasks to Save Time. Filter tasks by priority, then trash low priority ones that you might not need.
- Review Task Timing. Sort by duration with longest tasks first. You may be able to save time this way.
- Review Task Drivers. With this, you can review why the timing for tasks is falling like it is. Reasons can be dependencies and constraints.
Troubleshooting using Sort
Go to the View tab, then click the dropdown arrow below the Sort button. Select an option from the dropdown menu. You might sort by Start Date or Cost, for example.
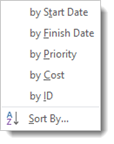
If you want to sort by additional criteria, click Sort By at the bottom of the dropdown menu.
You will then see this dialogue box:
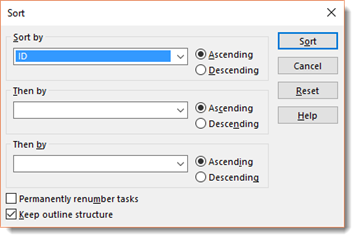
Choose your criteria in the Sort By field.
Choose if you want to sort ascending or descending.
Add additional sort criteria in the "Then by" fields.
Click Sort.
When you are troubleshooting, filters can be extremely helpful to pinpoint what's wrong and what you need to fix.
Remember, you can find filters under the View tab in the Data group.
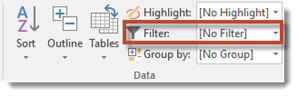
Click the downward arrow to view the dropdown menu.
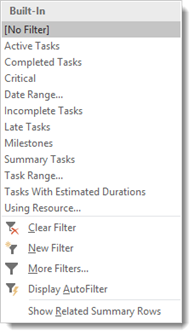
In the table below, you will see a list of filters along with what they display. This should help you isolate any problems much easier than if you tried to sort through all the information at once, by yourself.
|
Filter |
Displays: |
|
Critical |
Tasks that have to be completed on time if you are going to make the final deadline (critical path) |
|
Cost Overbudget |
Tasks that exceed budget |
|
Incomplete Tasks |
Tasks that aren't complete |
|
Late/ Overbudget tasks |
Tasks that are running later than the baseline estimate and are also overbudget |
|
Should Start By |
Tasks that were supposed to start by a specified date |
|
Slipped/ Late Progress |
Tasks that are running late. They also have no recorded progress |
|
Update Needed |
A task that should have had progress tracked by this point, but hasn't |
|
Overallocated Resources |
Tasks with resources that are overbooked |
|
Slipping Assignments |
Tasks involving resource work that should have begun already |
|
Work Incomplete |
Tasks that should have had all work completed already |
|
Work Overbudget |
More work hours have been invested in the task than you estimated |
Customizing and Formatting Your Project
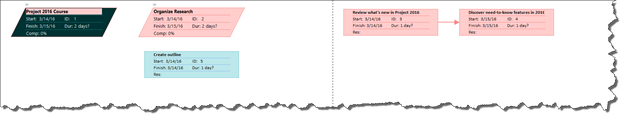
On the Network Diagram view, you've seen the little boxes that comprise the look and feel of it. This view uses different shapes to represent different task types.
- Summary Tasks use a slanted box shape and include a plus or minus symbol. Whether it is plus or minus depends on whether subtasks are shown or not.
- Subtasks are in rectangular boxes.
- Milestones are in diamond shaped boxes.
Project allows you to change the formatting by individual box or type.
To do this, go to Network Diagram View by clicking the View tab, then clicking the Network Diagram button. You'll see the Network Diagram view in the work area, as pictured below.
Right click on the task you want to change, then select Format Box. If you want to change all boxes, right click outside of the task boxes and then select Box Styles.
You will then see this dialogue box:
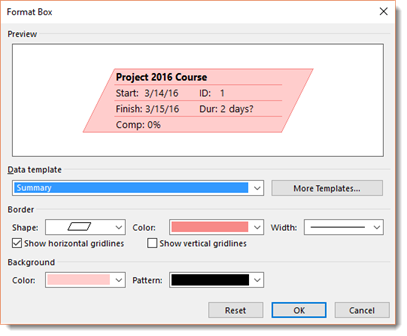
The Preview section of the dialogue box shows you the current look of the box - or the look of the box after you make any formatting changes. This allows you to see how changes you make in this dialogue box affect the look.
The Data Template section shows you what kind of box is currently selected. We've chosen a Summary box.
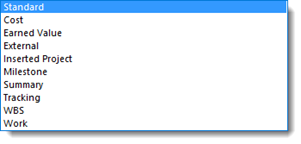
Let's click the dropdown menu for this section.
In the Border section, you can change the border shape, color, or width.
In the Background section, you can change the fill color or pattern.
In addition to changing text boxes, you can also change the layout of your view. Of course, your options in changing the view vary greatly from Network Diagram to Gantt chart to Calendar.
To view the Layout dialogue box for any view, right click in the work area of the view, then select Layout.
We are going to view the layout options for Calendar view.
Below is the Layout dialogue box for Calendar view.
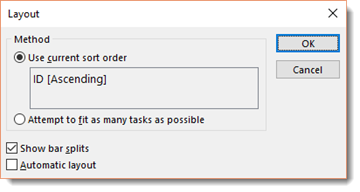
The options are self-explanatory. Click OK when you are finished.
Next, let's switch to Network Diagram view. You can see the Layout dialogue box for the Network Diagram view in the next snapshot.
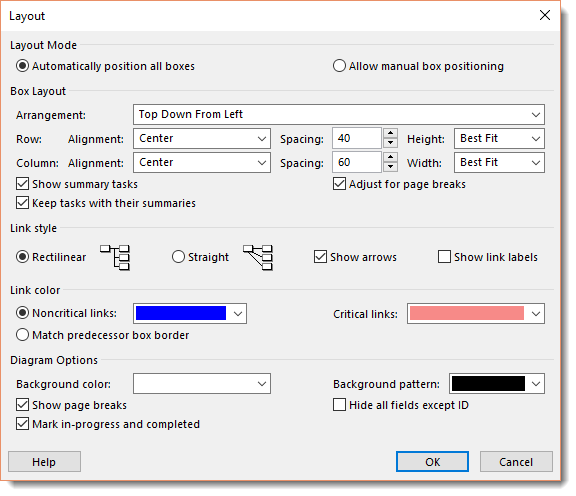
Again, although there are a lot of options in this dialogue box, they are self-explanatory.
To view layout options for Gantt Chart view, right click inside the chart area, not the worksheet. Select Layout from the context menu to see the Layout dialogue box.
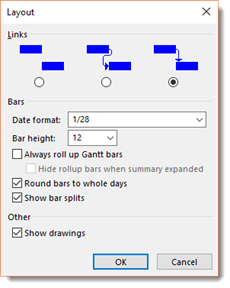
The settings in all three dialogue boxes allow you to change how the elements are arranged on the page and how dependency links are shown.
You could spend time playing around with the options for each view, and you are certainly welcome to do that. However, for now, we are going to present the formatting options given to you with each view and explain what it does.
|
Layout Type |
Option |
Use |
|
Calendar View |
Use Current Sort Order |
Uses the latest sort order applied to tasks |
|
Attempt to Fit as Many Tasks as Possible |
Ignores the sort order. Fits as many tasks into a date box as possible. |
|
|
Show Bar Splits |
Whenever you have a task that shows periods of inactivity, this task can be displayed as split into different parts over the time it takes to complete. |
|
|
Automatic Layout |
Modifies the layout to accommodate the insertion of tasks |
|
|
Network Diagram View |
Layout Mode Area |
Allows for automatic or manual positioning |
|
Box Layout Area |
Allows you to align boxes, adjust alignment, spacing, and height. You can also modify how summary tasks will be displayed. |
|
|
Link Style Area |
Allows modification of the styles in which dependency link lines and labels appear. |
|
|
Link Color Area |
Sets color for links |
|
|
Diagram Options Area |
This controls the background color and pattern for the boxes. It also controls how page breaks as well as progress on tasks are shown. |
|
|
Gantt Chart View |
Links |
Style of lines for the dependency links |
|
Date Format |
Changes the format used to display the date in task bars |
|
|
Bar Height |
Adjusts the height of the task bars (in points) |
|
|
Always Roll up Gantt Bars |
If you select this option, taskbar details will roll up to the highest level summary task. |
|
|
Round Bars to Whole Days |
Just as it sounds, this allows Project to round bars up so only whole days appear. |
|
|
Show Bar Splits |
Whenever you have a task that shows periods of inactivity, this task can be displayed as split into different parts over the time it takes to complete. |
|
|
Show Drawings |
If you include drawings, they will be displayed on screen and in the printed version. |
Modifying Gridlines
To modify gridlines, go to the area of any view that contains a grid, such as in Gantt chart or Calendar view.
Right click and select Gridlines, as shown in Gantt Chart view below.
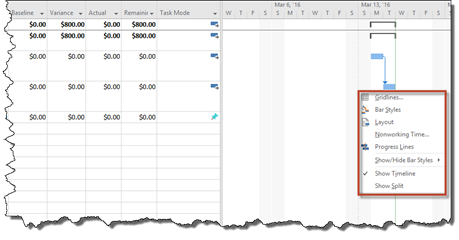
You will then see the Gridlines dialogue box.
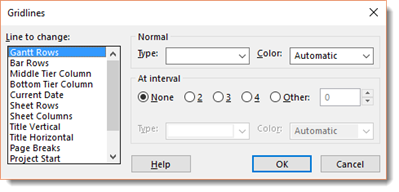
In the Line to Change list, select the gridline that you want to change.
In the Normal section, Type and Color allow you to select line style and color.
At Interval allows you to use a contrasting color at various intervals in the grid so that it is easier to read.
You can use the Drawing tools to draw images in the chart area of Gantt chart view.
To do this, go to Gantt Chart view, then go to the Format tab. Click the dropdown arrow below the Drawing button.
Choose what shape you want to draw from the dropdown menu.
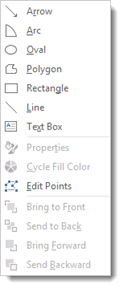
Click in the area of the chart where you want to add your drawing and drag your mouse until the drawing appears as you want it.
You can add filters to any bit of information.
To create a filter, go to Gantt chart view. Display the fields or columns that you want to filter.
Click the arrow for the column header you want to filter.
You can see the arrows in the column headings in the next snapshot. We've highlighted them for you.
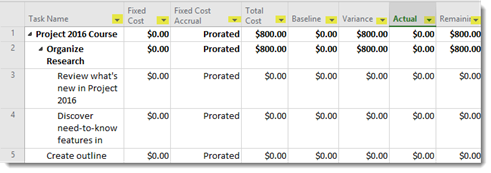
We are going to select Task Name and put a filter on it.
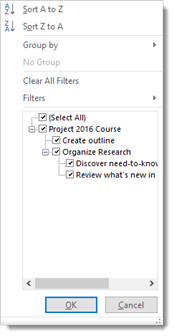
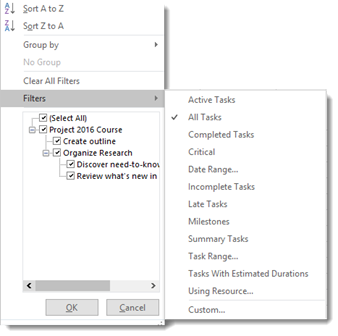
Click Filters to see your filtering options.
Select the criteria you want for the filter, or click Custom. When you click Custom, this dialogue box appears:
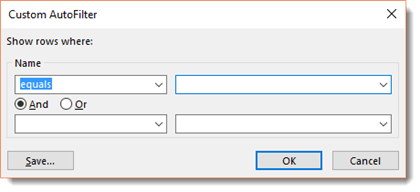
In the above box, you can set choices that are specific to each field of information.
The filters we've just used are predesigned filters. You can also create your own. Here's how.
Go to the View tab, then go to Filter in the Data group. Select More Filters from the dropdown menu.
The More Filters dialogue box will appear, as shown in the following snapshot.
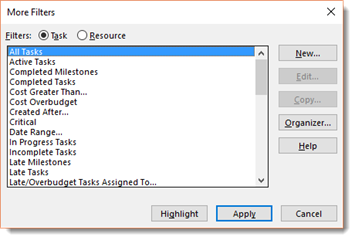
Choose either the task or resource to let Project know which list of filters that you want to include your new filter in.
Click the New button.
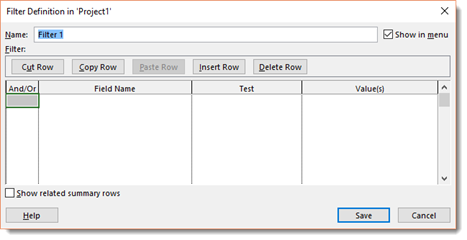
Type a name for the filter in the Name field.
Click the first line of the Field Name, then click the down arrow to display your list of choices.
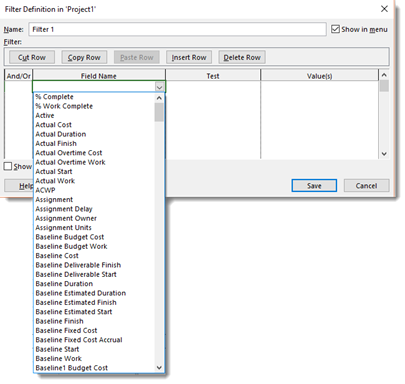
Click a Field Name to select it.
Repeat these steps for the Test and Value(s) columns.
- Test means a condition that must be met.
- Value(s) is a value that you enter such as a date or cost, or a predetermined value such as a baseline cost.
The group feature allows you to organize information by certain criteria.
To apply a predefined group:
Go to either Resource view or Gantt Chart view. We are going to go to Gantt Chart view.
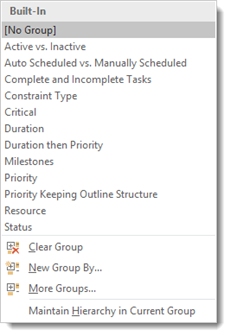
Under the Format tab in the Data group, go to Group By and click the downward arrow to see the dropdown menu, as shown below.
A custom group has three elements: field name, field type, and order. An example would be if you created a group that showed the field name and field type in a certain order (descending or ascending). A group that was created to show tasks in descending order would list tasks in order from the longest to the shortest duration. You can also control the font that is used in different groups or the font color.
To create a custom group, select More Groups in the Group By dropdown menu, which we accessed in the last section of this article. Remember, it's under the View tab.
You will then see the More Groups dialogue box.
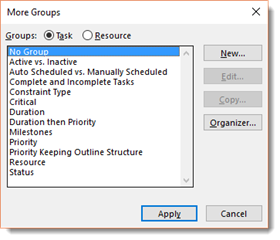
Select if you want to group by Task or Resource, then click New.
Now you will see the Group Definition dialogue box.
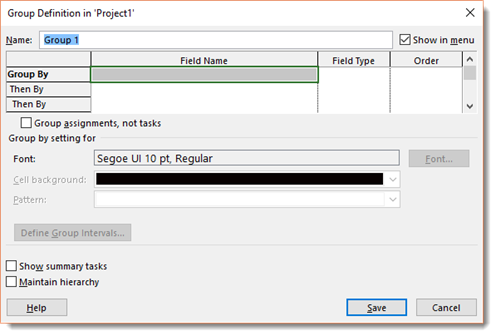
Name your group, then click the first line in the Name Field column. As we did with filters, a down arrow will now appear. Select a field name.
Repeat these steps for the Field Type and Order.
If you want to add more sorting criteria, click the row titled then by. You can keep adding criteria for your group by doing this. You can also check to have assignments, not tasks, grouped by clicking the Group assignments.
In the next section of the dialogue box, you can specify font, the background color for your cells, and the pattern.
Templates are simply files that you create and save that have certain settings. Just think of a website template. More than likely, you've used one before. The template has text and picture fields created for you, and also some formatting. It makes it a lot easier. So will your Project templates that you create because you can save your own settings.
Any template you create will be saved as a Project document. You can save any of your projects as templates. This is especially handy to do if you use a lot of the same tasks over and over in different projects.
In addition to tasks, these following things can also be saved in projects:
- All the information for each baseline.
- Actual values
- Rates for resources
- Fixed costs
To save a file as a template, open the file that you want to save and then go to File>Save As.
Microsoft saves templates in a folder called Templates.
In the Save As Type list, select Project Template.
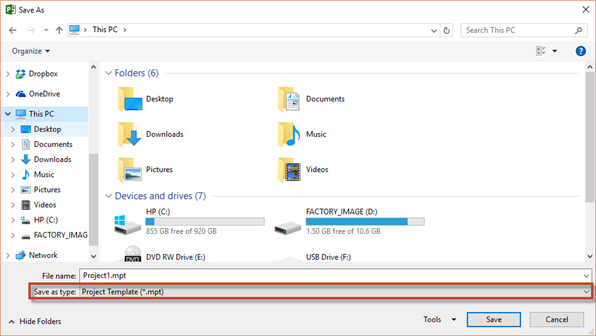
Click the Save button.
When you do, the Save as Template dialogue box appears.
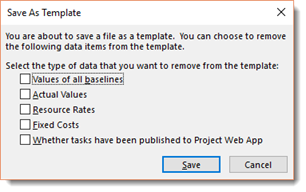
Put a check by the items that you do NOT want to save in your template, then click Save.
The file is now saved as a template with the MPT extension.