Finally! You've done it. You've taken the time to enter all your tasks, create dependencies, enter your resources, and assign your resources to tasks. Now you get your reward for all that work. Now you get to run reports.
Standard reports are predesigned reports that Project offers you. They offer a lot of choices regarding the information you can add, so at the same time that we say they're predesigned, they're also customizable.
You can choose the format for standard reports, such as a table, chart, or comparison report. Some let you choose the orientation (landscape or portrait). In addition, you can also customize standard reports by changing their name, the periods they cover, the table of information, and the filters. You can also add themes, formatting, images, and shapes to standard reports.
To run a standard report, go to the Report tab.
There are four standard report categories:
- Dashboard
- Resources
- Costs
- In progress
Each category contains several reports.
Pictured below is the different standard reports for the Resources Category
Running a Standard Report
To run a report, first click a report category, as we showed you in the last section.
We are going to choose the Resources Category.
Next, select a report.
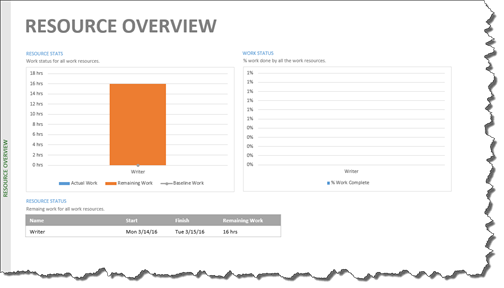
We are choosing Resource Overview just to show you how easy it is to run a standard report.
When we click on Resource Overview, the report is generated for us in the Project 2016 window.
About Dashboard Reports
Dashboard reports are new to Project 2016. There are five dashboard reports:
- Burndown
- Cost Overview
- Project Overview
- Upcoming Tasks
- Work Overview
To run a dashboard report, click the Dashboard dropdown arrow (under the Report tab), then select which report you want.
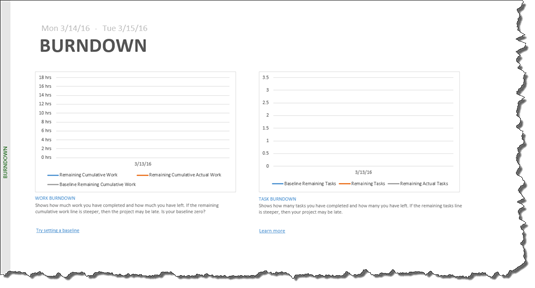
We are going to choose Burndown.
If you can't find the standard report that covers what you need, you can also create a new report.
To do this, go to click the New Report dropdown arrow under the Report tab.
You will then see this dropdown menu:
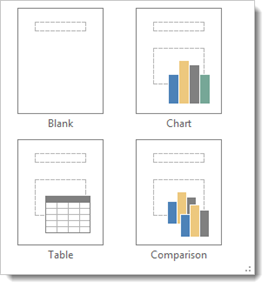
Choose if you want a blank, chart, table, or comparison report.
We are going to choose chart.
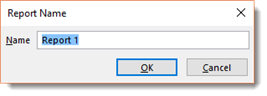
Enter a name for the report, then click OK.
You will now see this split window:
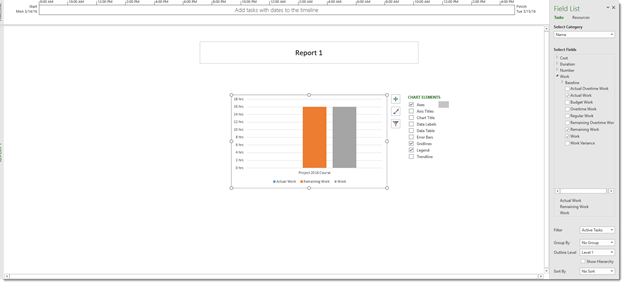
Your report is on the left. On the right is the Field List pane where you can choose fields for your report.
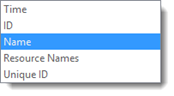
Go to the Select Category section in the Field List pane. Here you can choose Time, ID, Name, Resource Names, and Unique ID.
Next, go to the Select Fields category and chose the fields you want in your report by checking the boxes.
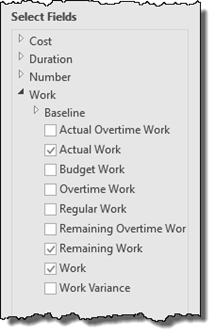
You can also apply a filter if you want.
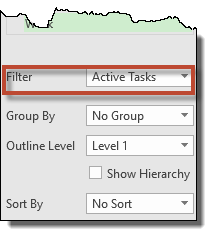
Select grouping from the Group By dropdown menu if you want to group information.
Select a level to view the information. Level 1 is the entire project.
Finally, choose how you want the data sorted. This is the order you want the data presented based on the fields you chose.
As we told you, you can also customize standard reports. There are three categories that you can edit or modify in a standard report.
These three categories are:
- Definition. The definition includes the name of the report, the time period for the report, the table of information, any filters that you've applied, and whether or not you want your summary of tasks to appear.
- Details. You can also include details for tasks such as task notes and predecessors. Details for resource assignments, notes, and cost can also be included. What's more, you can show tools, add a border, or place gridlines between the details of the report.
- Sort. Project allows you to sort by three criteria in ascending or descending order.
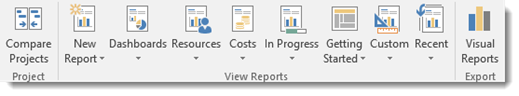
Once you create a report in Project 2016, a new tab will appear on the ribbon. This is the Report Tools Design tab, pictured below.
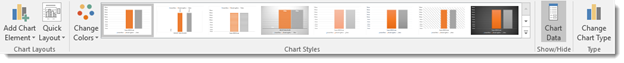
Using the tools in this tab, you can customize your standard report by adding a theme, changing the font, adding effects, etc. You can also add images, shapes, and text box. What's more, you can add page breaks, adjust the margins, and set the orientation or paper size.
These are all tools common to all Microsoft Office products. We can be almost 99.9% sure that if you are using Project 2016, you have also used other Office products and are familiar with these tools.
That said, instead of covering how to use these tools, we are going to cover three important guidelines for customizing and formatting your reports.
- Unlike with a Word document, you can't add graphics wherever you want. They can only be added to the chart pane of Gantt Chart view, a task note, a resource note, or a header, footer or legend in reports.
- Data in a chart can be formatted by double clicking on a chart section. When you do this, a Chart Tools Design tab appears and also a Format Plot area pane on the right side.
- Move or resize any item in a report by clicking it, then moving it or resizing it.
Creating Visual Reports
Visual reports are a lot like Pivot tables in Excel. They allow you to view data from different perspectives beyond the standard report capabilities. These perspectives are very useful for data analysis.
Project offers you six categories of Visual reports. Some of these are based on time phased data, or data distributed over time, and some are not. These categories are:
- Task Usage. This is based on time phased data for tasks and shows you cash flow and earned value over time.
- Resource Usage. This is based on time phased resource data and shows you resource availability, costs, and work data.
- Assignment Usage. This is also time phased data that shows baseline versus actual costs and baseline versus actual work.
- Task Summary, Resource Summary, and Assignment Summary. These provide diagram views of work and cost data. They are not time phased.
Creating a Visual report is easy.
To create and generate a Visual report, go to the Report tab, then click the Visual Reports button.
The Visual reports dialogue box now appears, as shown in the next snapshot.
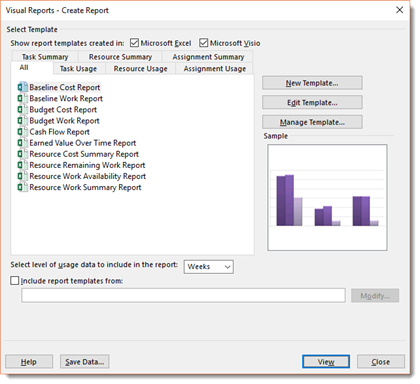
Select if you want the report template created in Excel or Visio, then select the report you want to view.
Click the View button.
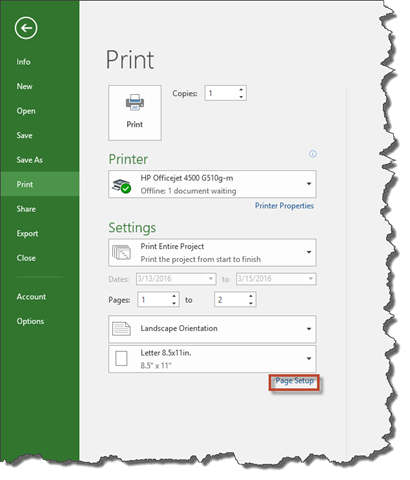
The first thing you always need to do before you print anything in Project is to view the page setup so you know that all the information you need will be printed on the page.
To modify the page setup for a report, go to the File tab to access to the Backstage View.
Click Print on the left.
Next, click on the Page Setup link, highlighted below.
You will then see the Page Setup dialogue box.
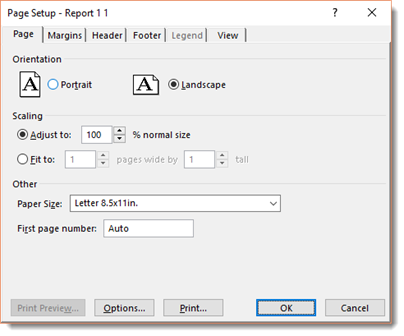
As you can see, there are six tabs in this dialogue box. The Page tab will help you set the paper size, orientation, and scaling.
If you need to adjust your margins, click on the Margin tab. If you need more room for your report to display, you can always reduce margins. You can increase margins if you have a brief report, but do not want to hand out a report that only fills a small part of the page.
If you've used headers and footers in your report, you will find the Headers and Footers tabs helpful.
The Legend tab will help you create a legend to explain the various graphic elements. The legend is automatically created for you. All you have to do is specify the text that goes with the legend.
The View tab allows you to select if you want to print all columns, how many columns per page, print notes, and print blank pages. You can also choose to print column totals. This pertains to the Usage views.
When you have your page setup, click OK. To print, click the Print button at the top of the window.
Consolidating Projects and Resources
In Project, a resource pool can mean one of two things. It can be resources that are bundled as a group and assigned to a project, or it can mean a group of resources that are created and made accessible to anyone who has access to your company's server. In this section of the article, we are going to focus on the second definition and learn how to create a resource pool that you and others can access.
However, before we delve into creating a resource pool, we need to discuss a few terms that you need to know in order to be able to understand how to add to or access resources in the resource pool
The first term is "Resource Pool Project." "Resource Pool Project" is the term used for the project that will share (or add) resources with the pool. If you add resources from your current project to the pool, the project that you use to add resources is the "Resource Pool Project."
The other term is "sharer." A project that accesses and uses resources from the resource pool is the sharer project.
Creating a resource pool is very easy and not nearly as complicated as it sounds. You can create a resource pool using a blank project and adding resources to it. Do this using the Resource Sheet.
Next, save this to a location that those who will use the resources in their own projects can access.
Resource engagements are new to Project 2016 and are only available to you if you're using Project Professional 2016 or Project Pro for Office 365. In addition, you must also be connected to Project Online or Project Server 2016.
A resource engagement is an agreement between you and a resource manager that gives you permission to use a resource from a resource pool when the resource has limited availability.
This is how it works.
When there's an enterprise resource pool, the resource manager can select some resources that must have approval in order to be used within a project. You, as the project manager, would have to request use of that resource.
You would contact the resource manager to gain that permission by sending an engagement request in Project. You'll give the dates you'll need the resource, plus a percentage of the resource's time during those dates or a set number of hours for those dates.
To send an engagement request, click the Add Engagement button under the Resource tab. Select the resource. You will then see a dialogue box where you can fill out the dates and other information.
Click OK when you're finished.
Next, go to Resource Plan View.
Click on the engagement you added, then go to Engagements >Submit > Submit Selected Engagements.
You will see "Proposed" in the Engagement Status column.
Now, let's learn how to access resources in a resource pool.
Open the resource pool file and the sharer project. In the sharer project, go to Resource tab. Click the Resource Pool dropdown arrow and select Share Resources.
The Share Resources dialogue box then appears.
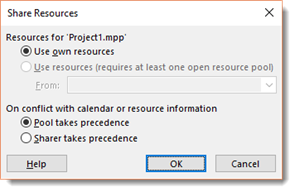
Select if you want to use your own resources, or choose the project that you want to share resources from.
Next, decide what you want to occur if a conflicting resource setting exists, such as the resource base calendar. If you want your project's settings to take precedence, choose Sharer Takes Precedence.
Click OK.
You can also update assignments and tasks in your sharer file, or the project that's sharing files with the resource pool. To do this, go to the View tab. Click Resource Usage button and then update assignments. You can also update time phased, scheduled, or actual work by updating in the Resource Usage and Task Usage views.
To consolidate projects means to take several projects and combine them into one to create a master project. At that point, all of the projects that you inserted into the master project become subprojects. Although we've already talked about inserting another project into a current project, we wanted to introduce the topic again as a way to consolidate several projects into one.
Let's review how to do it.
To consolidate projects:
Open the project that you want to use as the master project.
Then, go to Gantt Chart View.
Click a task name. You should click the row below where you want to insert another project. This means the new project will be inserted in the row above where you click.
Go to the Project tab, then click the Subproject button on the left.
You will see this dialogue box:
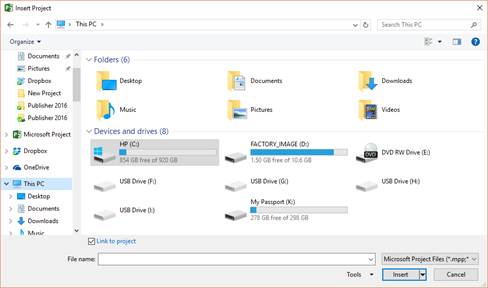
Locate the location of the project on your server or computer, then click to select it.
Click the Insert button. that you want to insert and click Insert.