The value stream refers to all processes and actions taken � both value and non-value adding- to convert raw materials into a finished product or deliver a service. Value stream mapping is a visual tool that aid businesses to plot all the tasks needed to receive an order from the client and satisfy it. It offers the visual means to;
-
Map out the visual causes of waste such as waiting, overproduction, motion and unnecessary processing.
-
Identify opportunities to enhance flow, minimize waste, and balance production across labour and equipment.
-
Communicate the state of the business process, and performance in a way that everyone understands.
VSM Gives Two Type of Maps
1. Current State VSM � used to show the characteristics and current state of the business's value stream.
2. Current value stream � use to depict the desired future state of the business's value stream, if measures were taken to smoothen flow, shift from push based production system to market demand (pull-based) production and, to reduce waste.
In lean management, value stream mapping is used to;
-
Graphically show, analyze, and interpret the flow of resources (materials and information) required in the production process. Note that unlike process maps that are only used to map the sequence of activities needed to complete a process or procedure, VSM offers the means to;
Depict the relationship between multiple departments/functions that contribute to the production process and supporting functions for example materials management, production planning, scheduling and more.
Map out the flow of materials and channels of communication (information) throughout the production process. It's good to note that in-process material and coordination are typical courses of significant waste in most un-leaned businesses. VSM offers managers a tool for visualizing and recognizing these limiting factors.
-
Identify inefficiencies, problems and losses within matrix organizations. Since VSM integrates information and material flow and the order of tasks, including lag between tasks and cycle time, it boosts the capacity to identify bottlenecks, restrictions, and multiple other factors that constraint efficiency and effectiveness.
-
Develop and facilitate implementation of highly visual measures that promote positive culture change in an organization. The entire VSM process uses graphical illustrations of limiting factor that anyone in the organization can understand. The VSM process, in itself, is designed to involve all stakeholders (including the external receivers).
-
Focus direction and efforts of the upper management and lean transformation team towards continuous improvement.
-
Act as a dashboard for monitoring and continuously improving the production process.
How to Develop a VSM Map � A Step by Step Guide
1. First Pass: Understand the Current State
-
First, decide exactly what you want to map. In a production firm with multiple lines of products, you may have to do some groundwork to establish what product, product lines and family of products are worth mapping. A common practice is to map the lines with the highest value or volume. Alternatively, take a long-term strategic view and go with the product lines that are expected to bring more business in the life-time of the organization. You can also be guided by what your customers want you to map (the value they are demanding).
A quick note: In a manufacturing firm with numerous products, it's good to perform a product family analysis which is basically a review of the various products and the production process involved. However, if the product lines are too many, it might not be viable to analyze each product. Apply the principles of Pareto analysis to determine which products are worth mapping (either on the basis of value, volume or both). Pareto analysis helps in grouping of products with similar characteristics, making it possible for the VSM team to focus on a family of products with similar characteristics or on a single product.
-
Train your lead management team: Choose a cross-functional team that draws individuals from the entire process to be mapped. The team must bring together operators and maintenance employees, as well as individuals from support departments with first-hand knowledge and experience of the area or process to be mapped.
-
Physically visit the work area and walk the path of information and material flow, starting from every source of both primary and secondary materials needed to support the manufacturing process being mapped.
-
During the walk-down, document every step as it's discovered or observed. Identify all communication points as well as how communication occurs.
-
Use this information to model your current state value stream map, and add all the relevant information and data to it. During this stage, do not short-cut the process or skimp on details. Dig deep until you are sure the VSM accurately depicts the current process.
The figure below gives an illustrative example of a current state VSM, assuming a winery. It is followed by a short discussion of the main components of the map.
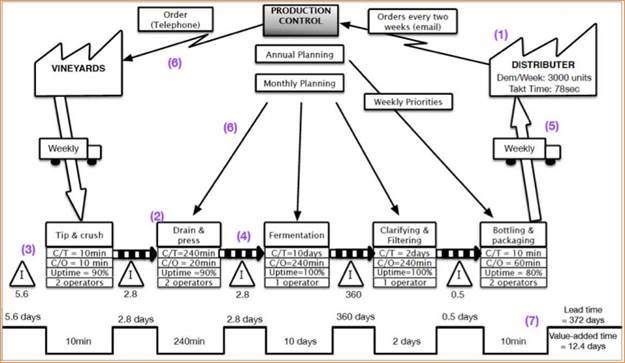
Sample Current State VSM
As shown in the diagram, the VSM of a winery can be mapped in a standard order using pre-defined icons;
1. The distributer (customer) and the firm's suppliers are represented by factory icons. Information about the production demand from the distributor is recorded in a data box around the icon.
2. The main manufacturing processes of the winery are depicted using a process box. In VSM, a process is defined as a single area of resource (material) flow. Therefore, a process ceases, (and another starts) wherever production is disconnected and flow of material stops, causing accumulation of stocks between successive work stages. A process box must record the following data for the specific process;
-
Cycle time (given as C/T) � The length of time between a specific bath coming off, and the successful one coming in.
-
Changeover Time (given as C/O) � The time needed to setup a machine or a series of linked machines from manufacturing of a specific product, to a different one.
-
Uptime (given as a percentage) � Depicts the reliability of a machine or process.
-
Operators �Gives the number of workers needed to complete a process. It's usually denoted using the following symbol
-
More information can also be given in the map such as the process defects (error rate), the number of employees shifts needed per process and more.
3. Accumulated stock (both prior to and after the process) is depicted using a triangle, and the exact amount underneath (either in terms of days worth of stock or units of stock).
4. The push transfer of stock from a process to another is depicted using a striped arrow.
5. Transfer of final product is depicted using a broad arrow.
6. Exchange of information between the business management process, suppliers and customers is depicted using 2 types of arrows;
-
Arrows that show information exchange by papers
-
Arrows that show information exchange by electronic means.
7. Finally, timeline (shown below the VSM) summarizes 2 vital performance metrics of production: the production lead time and the value-added time.
Second Pass: Analyze and Reflect
-
Work with the team and reach a consensus that your current state VSM depicts your business processes. Then, socialize it with all people involved in the area or process to be mapped and obtain their true consensus that it truly reflects the processes being mapped.
-
Identify any deficiency, losses, or limiting factors affecting effectiveness of the current state VSM. Think beyond the obvious and do not accept to be constrained by artificial boundaries or perceptions. Then, quantify the effect on cost and performance for each of the identified limiting factors.
NB: Ensure you identify the true cause of "WASTE", not just the symptoms, of all the identified limiting factors.
-
Develop and implement cost-effective remedies for each of the deficiencies constraining efficiency and effectiveness of the VSM. Make sure the solutions directly remedy the root cause of all the identified factors and are affordable.
-
Adapt the value steam map to align it with the proposed changes designed to eradicate or minimize the limiting factors. Ensure that all proposed changes are accurate and illustrated in your future state map.
Third Pass: Improve
-
Socialize the proposed future state VSM with all concerned parties. It is vital that you obtain their buy in and consensus before moving on to the implementation stage. Make sure that everyone with concerns is afforded the opportunity to review and comment on the desired future state map.
-
Change all affected checklists, procedures, training materials and bills of material to show the changes to be effected to attain the desired future state VSM. This step cannot be skipped or omitted without serious reduction in tangible benefits of the desired future state VSM.
-
Train all affected workers on the proposed checklists and procedures. Ensure they are properly trained and they can successfully apply them prior to implementation.
-
Implement the new procedures (identified via the VSM process), on the bases of descending priority, i.e., the one with the most benefits first and fully documented.
NB: The trick is to implement the changes in small increments with adequate time between successful changes to establish the realized benefits gained from each change.
Fourth Pass: Sustain
-
Develop appropriate KPIs that accurately measure the cost and performance gain for specific processes. These KPIs, together with verified baseline of the current state process, are used to validate the change.
-
Monitor and ensure compliance with the new practices and standard procedures developed as part of the improvement process. It is misleading to assume that all parties will willingly and immediately comply with the changes being put in place.
-
Lastly, the verified and validated processes improvements should be institutionalized..
Push and Pull Systems in Lean Manufacturing
Key Definitions
1. First In First Out � FIFO means that the oldest inventories are sold first.
2. Lead time � The time between the beginning and the end of a production process.
Traditional manufacturing (push systems) focuses on using information about supplies, production and customers to manage materials flow. The name push is derived from the manner in which traditional manufacturing systems work:
Normally, materials and/or parts are made and then they are sent to the workspace where they are, or maybe needed next (the next step in production or warehouse - inventory). As such, traditional production set up "Pushes Materials" through production resulting in build-up of stock (one of the 7 wastes that lean manufacturing seeks to eliminate).
Lean management seeks to eliminate inventory, and it advocates for a pull production system.
Pull Manufacturing:
Pull manufacturing is a production methodology that controls manufacturing from its end backward. It is a manufacturing methodology that controls production from the end of the process. It seeks to boost efficiency by eliminating or minimizing overproduction and inventory. In pull production, all effort focusses on the next stage in the manufacturing process and what is needed there. In other word, raw materials are pulled (by the customer orders) from the end of the manufacturing process (sales) through the production process that converts them to finished goods that deliver value to the client. In a pull system, only that which is needed in the next stage of production is manufactured, and a production run can only start once an order has been received. Because of these features, pull manufacturing is commonly described using terms such as Toyota Production system, Action Workout, Stockless production, or JIT (just in time production). Pull production works in the exact opposite way to push production.
The difference Between Pull Manufacturing and Push Manufacturing
1. Push manufacturing promotes manufacturing in large batches. It aims to manufacture the largest number of units possible per production run. Lean production seeks to manufacture only that which customers have demanded. I.e., a car is produced only if there is an order from a customer.
2. Push manufacturing encourages management to maintain stocks. The stocks are then pushed into the market through distributors. The distributors then supply the products to the retailers. On the contrary, lean production supplies the product directly to the external receiver (the consumer). Inventory is discouraged. However, a middleman may be needed (for instance, a car dealer in case of a custom built car).
3. Planning for push production relies on complex factors such as competition, market prices, time taken to get the production to the customer, additional production needed to meet the extra demand arising from an advertising campaign that has been launched, inventory levels and more. Therefore, the planning is complex and in most cases, it requires enterprise planning tools. On the contrary, pull production is easy to manage because it's based on market demand. The exact figures are known, making production planning easy.
4. In push production, production and sales cycle are viewed as different processes. In a pull system, the two are intertwined because production is only done in response to current demand figures.
5. Batch production seeks to push the product to the market. Pull manufacturing allows the market to pull the product through the production process, based on its actual demand. In short, push production is supply-driven while lean manufacturing is demand-oriented.
6. A lot of waste is generated in push production system, especially waste of inventory and waiting. The primary goal of lean production is to eradicate all forms of waste.
7. Mass production workspaces are characterized by heavy machinery. The machines normally work in shifts. On the other hand, pull oriented work spaces may not feature heavy machines. Effort is made to use compact, easy to set up and movable machines.
The table below shows the major differences between traditional manufacturing (push production) and lean manufacturing (pull production).
|
Push Manufacturing |
Pull manufacturing |
|
|
Scheduling |
Based on forecasts |
Based on actual market demand |
|
Production units |
Seeks to build inventory |
To meet customer order |
|
Batch size |
Large |
Small � encourages continuous flow. |
|
Lead time |
Long |
As short as possible. |
|
Inspection |
Done on selected items (sampling) by inspectors. |
100% inspection at the sources by the worker. |
|
Production layout |
On functional basis |
Done to promote product flow. |
|
Employee empowerment |
Low |
High |
|
Stock turns |
Low; typically less than 7 |
High; normally more than 10 |
|
Flexibility |
Low |
High |
|
Cost of goods sold |
High and rising. |
Low and diminishing. |
The primary objective of lean manufacturing is to:
-
Identify bottlenecks in the production process and in doing so, increase throughput.
-
Eliminate inventory via capacity control
-
Facilitate identification and eradication of constraints in the production process.
-
Yield a better product mmix via enhanced line balancing.
Principle of pull systems
The primary principle of pull manufacturing is production should only be done when required.
-
I.E., raw materials shouldn't be processed at all, unless it is required in the next stage f production, and finally by the customer.
The goal of this rule is to avoid accumulation of inventory; WIP or goods that have been produced but are not needed in the market. This eradicates the waste of Inventory.
-
Materials should not be moved unless it's needed in the next stage of production.
Material that is received pre-maturely promotes build-up of inventory. Also, it overburdens the material receipt workspace.
-
Materials shouldn't be stored for long durations and it should only be ordered in response to a customer order.
This is because everything that is produced represents an investment of money and time. The longer it remains unused, the longer it will take to recoup the money, and while in store, it uses up space.
-
Each work centre should have a pre-determined level of inventory, additional production can only take place if some have been consumed.
This rule forces managers of various work centres to produce only that which is required; the moment the maximum amount of production has been attained, production ceases.
Kanban, The signal for work in a pull system
This refers to a signal sent from a certain work centre to the one that supplies it with materials, requesting for a defined action. If work centre B sends a Kanban requesting 4 parts from work area A, Kanban A will produce and ship only 4 parts; no extras, no shortages. For instance, if a milk man is part of Kanban system, if he sees an empty bottle, he will replace it. If he sees two empty bottles, he replaces both. If he is not seeing any empty bottles, he stops and does nothing.
-
A Kanban signals that production should start, by communicating to the work centre exactly what and when to manufacture. In most Kanban systems, the "what" is given in the Kanban signal itself, and the "when" is always immediately upon receiving the Kanban.
For example, in our milk man illustration, if the milkman receives two bottles, a white and brown one. He will replace 1 chocolate milk bottle and 1 normal milk bottle. NB; the colour of the bottle signals the type of milk that he or she should replace.
-
If a supplier does not receive any signal (Kanban) he does nothing, moves nothing, stores nothing and produces nothing.
For example, if the milkman added a bottle every time he had time to do so, the specific work area would run out of space to store the excess milk pretty quick.
Kanban coordinates the entire production system by linking work areas together. However, Kanban give rise to idle workers.
Rules of Kanban
There are not hard rules for Just in time manufacturing. It assumes you will do what you ought to, to avoid compromising the project. However, there are 8 rules that managers must follow for a pull system to work properly;
1. Don't produce beyond the Kanban ceiling.
-
The Kanban ceiling must always be observed.
-
Manufacturing must adherence to the Kanban signals; otherwise, the whole system will become ineffective.
-
The Kanban may require to be raised. But this should be limited to a few times in a year.
-
Over time, it might become necessary to permanently incorporate more Kanban into the system. In effect, the raises the Kanban ceiling.
-
During such a review, it is okay to add a few emergency Kanban.
2. Materials must move following a Kanban
-
Any material that moves without a Kanban (pull) is a waste.
-
Unnecessary transportation of materials is among the 7 wastes that lean management seeks to eliminate and should be avoided.
3. Never pass defects
-
Moving a defect through the production system is a major cause of waste.
-
Management must train workers to recognize defects and never all them to be pulled through the system.
-
If it's possible to rework the defect, it's okay to do so, but it should be in response to a Kanban.
-
Reworking defects can initiate temporary system imbalances, but it is usually preferable to beef up a defect to a finished product.
4. First In First Out
-
Work areas must execute all Kanban in FIFO basis.
-
Compromising this rule creates severe delays and line imbalances.
5. The customer should pull the materials from the supplier;
-
Kanban should only originate from work station that requires the materials.
-
Orders should only arise from the work centre that needs the materials.
-
Normally, this system is easy to operate, but it becomes complex if a specific work centre is supplied by multiple work centres.
-
Is such situations, it becomes wise to necessary to build a separate queue for every supplier in front of the bottleneck work station.
-
If this queue starts to fill, a Kanban is sent to suppliers that signal them to slow down, and once it is full, a stop Kanban is sent.
6. Only active materials should be at a work station
-
Only material that is needed or is about to be used should be at work centres.
-
This is mainly because excess materials clutter the work centre and decrease efficiency and productivity.
-
If at any time excess material is present where it should not be, then it is a clear sign that the pull system isn't working as it should.
-
Either, raw materials were sent before they were needed, or an order was initiated before it was necessary to do so.
7. Everything has its own place and there is a place for everything
-
Work station organization is essential to maintenance of a pull system.
-
In absence of a well-organized work station, it is hard to tell the orders that have been placed and the once that have not.
-
Different materials and Kanban should be stored in separate section to facilitate visual inspection of inventory levels.
8. Minimize Kanban to reveal constraints
-
Once a Kanban system is in place, efforts should be put to reduce the number of Kanban with a view to expose constraints.
-
If it's impossible to reduce the number, every effort should be exercised to eliminate the constraints, until it's possible to decrease the number of Kanban.
-
One striking feature of Kanban is that they allow one less at a time method to be practised, one only needs to remove one unit from stock by adjusting Kanban values.