When you want to track the progress being made on a project, you must enter different kinds of information. You must tell Project 2016 when you want to track progress. You can track by your computer's current date and time, but you can also do it by a specified date, such as the end of the month.
In addition, you can enter the actual start and finish dates of tasks, the percent complete, and the hours a resource spent on a task.
If you think a task will take more or less time than originally scheduled, you can change the duration. What's more, you can enter materials used and fixed-costs for expenses such as outsourcing fees or shipping costs.
When you want to track the progress on your project, it is important to first enter a status date. Project will, by default, use the time and date settings on your computer. However, let's say that you want to track the project's status through the last day of the month, then enter the data. You can also use Update Tasks along with it because you can mark tasks complete up through that date.
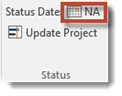
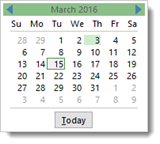
To set a status date, go to the Project tab, then click on the Status Date button.
Select a status date.
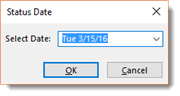
Click OK.
You can click the downward arrow to display the calendar and select a status date.
When you are trying to enter a project status, and you notice that a task will be on schedule as of that status date, you can mark the task as part of the way complete as of the status date.
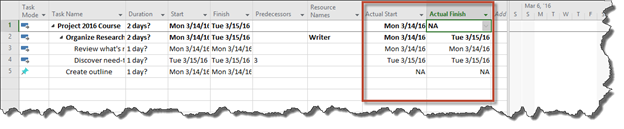
If a task is complete, Project 2016 will automatically assume that the task was started and finished on time. However, if you are wanting to track progress, you'll want to enter the actual start and finish times for each task.
To do this, go to either the Actual Start or Actual Finish fields in the worksheet area of Gantt Chart view in Tracking Gantt View.
NOTE: To go to this view, click the dropdown arrow for the Gantt Chart button under Task tab, and select Tracking Gantt.
Use the dropdown calendar for Actual Start or Actual finish and specify a date.
It is going to be important for you to be able to tell how many hours a resource spends on the project. This is especially important if you have employees or contractors working on the project.
Here's how to enter resource hours:
Go to the Task Usage view by clicking the downward arrow for the Gantt Chart button under the Task tab.
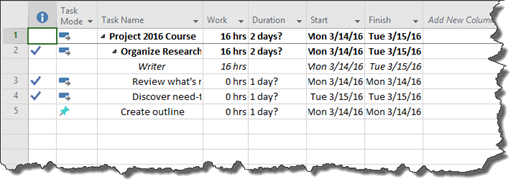
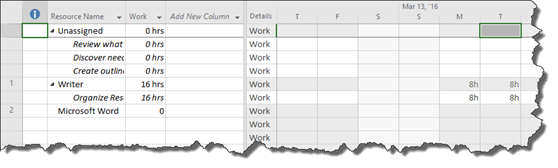
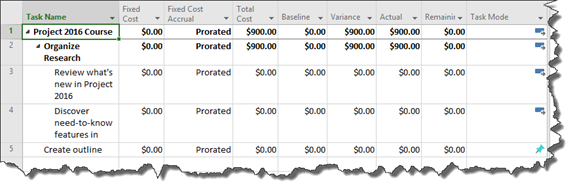
Find the tasks that you want to track, along with its assigned resources. Resources are listed in a row below the task name, as pictured below. We have highlighted the resource in yellow.

Type in the number of hours the resource was used. To enter total hours, insert the column named Actual Work into the sheet. To do this, right click on a column, select Insert column, then select Actual Work.
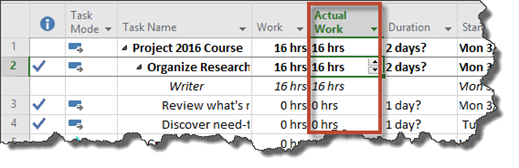
To enter in the hours on the task for each day, right click in the chart pane (right side of the window). Choose Actual Work. The row labeled Act. Work will appear.
Click on the Act. Work cell for the day in which the resource worked, then enter a number.
To enter overtime for a resource, go to Resource Usage view by going to the Task tab, then selecting Resource Usage from the dropdown menu.
Insert a new column as we've already learned to do. Select Overtime Work from the list for the type of new column.
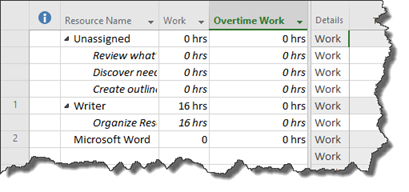
Next, click in the column for an assignment for the resource, then click the up or down arrows to specify overtime hours worked.
We are going to select the Writer as the resource for the Organize Research assignment.
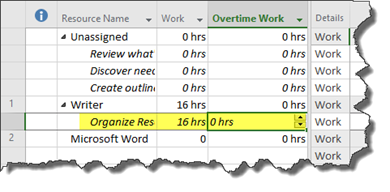
Now we are going to use the up and down arrows in the Overtime Work field to add in the amount of overtime.
If the duration of an autoscheduled task has changed while it is in progress or already completed, you will have to enter those changes into Project 2016.
To do this, go to Gantt Chart view.
Go to View tab, then click the downward arrow for the Tables button.
Select Tracking.
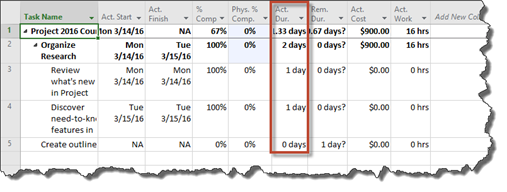
The Tracking table is then displayed.
Go to the Actual Duration column for the task you want to edit the duration.
Enter the actual duration.
Fixed costs aren't changed by time. In other words, they aren't hourly or daily charges. It is just a set fee.
To track fixed costs, go to Gantt Chart view.
Go to View tab, then click the downward arrow on the Tables button.
Select Cost.
You will then see the Cost table in the worksheet area.
Go to the Fixed Cost column for the task you need to update, then type the fixed cost. You can even enter in several fixed costs. It is that easy!
Communication and Progress Updates
It is important that you map out what information you need to track as the project commences and advances.
- Who will have the information you need to track?
- How should that information be delivered to you?
- How often do you need this information?
By creating a communications plan, you can specify ahead of time what information you need, who will deliver it to you, and how often. You can create a communications plan easily enough using Excel.
It should include:
- The person responsible for communicating information to you.
- The information they will share with you.
- The method they will use to share it (email, report, meeting, etc.).
- The frequency they will share the information (daily, weekly, bi-weekly, etc.).
Tracking Information and Data
As we said, it is important that key people, or stakeholders, within the project communicate progress to you. If a project is off-schedule, you need to know. If there is more overtime that allocated, you need to know. All these things need to be reported to you, then entered into Project 2016.
There are several methods you can use to enter and track this data as well.
The first of the methods exist under the Task tab in the Schedule group in Gantt Chart view.
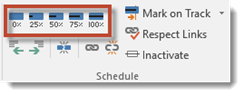
The blue buttons, pictured above, let you mark the completion of a task by a percentage.
If you click Mark on Track, Project will record activity for a task automatically to the status date as scheduled in the baseline.You can also select Update Tasks from the Mark on Track downward arrow. In the Update Tasks dialogue box, you can find and enter information about progress, start/finish dates, and duration.
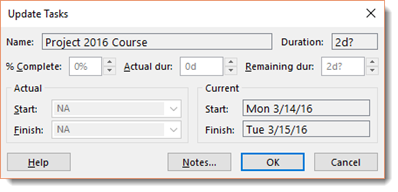
The fields in this dialogue box are self-explanatory.
There are other tools you can use to enter and track progress in Project 2016, aside from the ones we talked about in the last section.
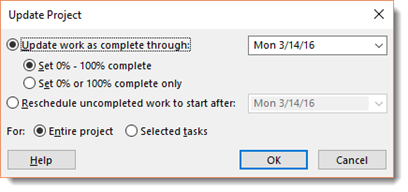
You can mark all tasks complete up to a specific status date by going to the Project tab, then clicking the Update Project button in the Status group.
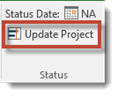
When you click on the Update Project button, you'll see this dialogue box:
Rescheduling Tasks
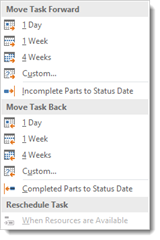
You can also move a task to reschedule all or part of it. This tool is found under the Task tab in Gantt Chart view.
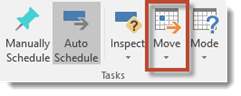
Click the downward arrow.
In addition, you can add a progress line. A progress line is a visual representation of your project's progress. You will see the progress lines appear in Gantt Chart view in the chart area.
To add progress lines, go to the Format tab in Gantt Chart view.
Click the downward arrow.
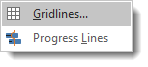
Select Progress Lines.
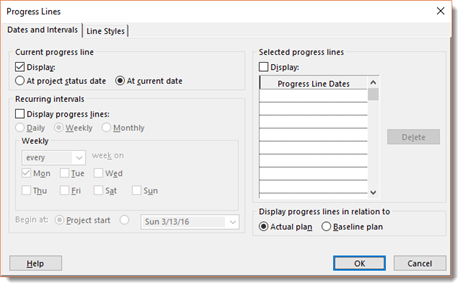
You will now see the Progress Lines dialogue box.
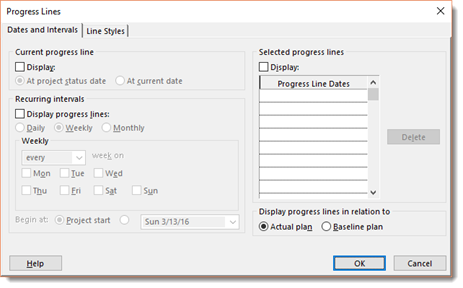
Progress lines will show the tasks that are ahead or behind schedule by displaying a red vertical line. The line will connect tasks that are in progress.
Put a checkmark in the Display checkbox, then decide if you want to display the current project line at Project Status Date or Current Date.
Next, select when you'd like to see the progress lines recur, such as daily, weekly, or monthly.
In the Selected Progress Lines section, select a date for a progress line. While other progress lines will be red, this will be black.
Click OK when you are finished.
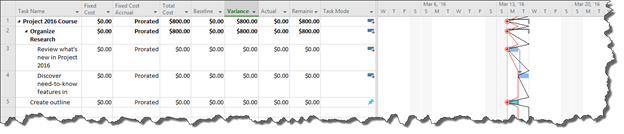
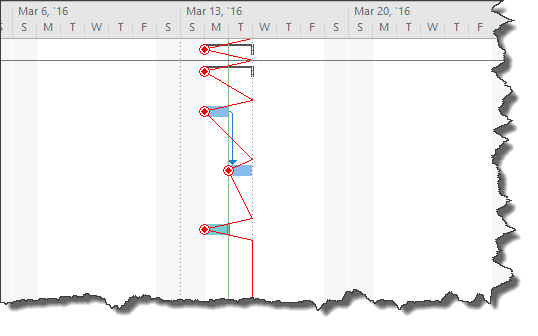
You can see progress lines in our project.
How to Interpret Project Lines
Adding project lines to your chart is fairly easy. However, interpreting them can be a challenge if you've never used them before.
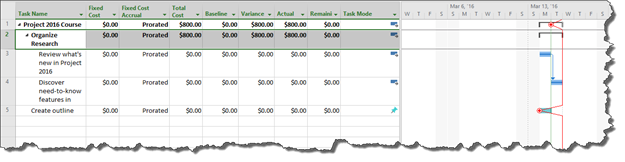
Take a look at the progress line in our snapshot below:
Let's zoom in a little so you can see it up close.
Below is the dialogue box where we set our options. You can see the progress line is displayed for the current date.
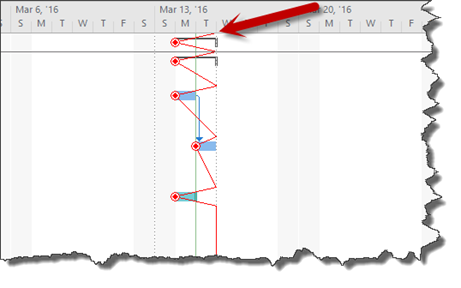
You can look at the progress line on the chart to see it's for today's date by going to the top where the progress line beings.
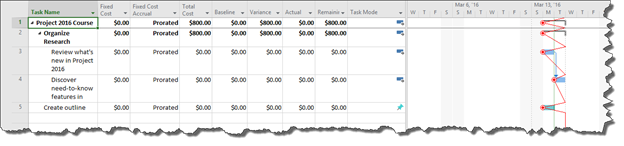
The progress line then goes down the chart. It connects to tasks that are in progress, as well as tasks that should be in progress. If the line peaks to the left, that means the work for that task is behind schedule. The larger the peak, the further behind schedule. On the other hand, if it peaks to the right, it means a task is ahead of schedule. Peaks are marked by the red circles.
NOTE: Remember, to mark the progression of a task manually, double click on the task in Gantt Chart view.
In the snapshot above, all our tasks our behind schedule. When we marked a task completed, you can see how the progress line changed.
Using Views to Update and View Progress
Project 2016 has several views. These views can be used to enter in progress and status updates, as well as to view progress on your project.
Below is a chart that lists the tracking views that you can use to enter and view tracking information.
|
What You Want to Track |
Tracking View |
Table or Column Displayed |
|
Assignment (time phased) |
Task Usage |
Work Row |
|
Assignment |
Task Usage |
Tracking table |
|
Task (time phased) |
Task Sheet |
Actual work row |
|
Task |
Task Sheet |
Tracking table |