When running a business, you will want an easy way to check up on how things are going. You can accomplish this by running reports. You can run reports on all sorts of information that QuickBooks Online stores for you.
In addition to making fast reports, QuickBooks Online also makes it easy to create management reports. These are a series of other reports for specific managerial analysis, and they are put together in a professional manner that makes them appropriate for handing off to other parties.
In this article, you will learn how to run various types of reports. You will see what reports QuickBooks Online already has premade for you, and then you will see how you can customize your own report. Lastly, you will see how you can access and customize management reports.
The Reports Page
To start using reports, click on the Reports menu item in the left-side Navigation Pane. At the Reports page, you will see that it is divided into three tabs: Standard, Custom, and Management Reports.
The Standard tab has all the common reports organized into different sections. At the top of the Standard page is the Favorites section. Any report that you click the start button next to will appear here.
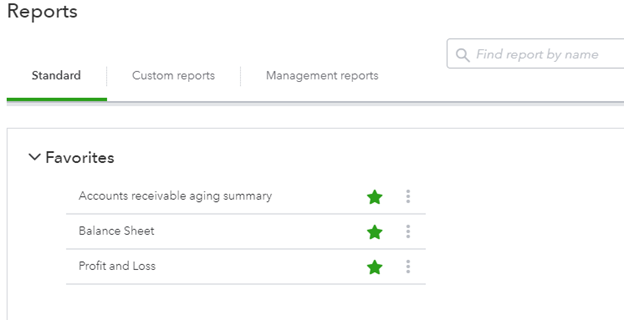
[Figure: Reports that you put a star next to will appear in the Favorites section]
After the Favorites section, you will see lists of all the reports made available to you depending on your subscription level and whether you are enrolled in other services, such as Payroll. To learn more about any report, click on the question mark icon that appears when you roll your mouse over any report name.
Business Overview
Directly below the Favorites section, you will see the Business Overview section. This includes reports such as:
- Audit Log
- Balance Sheet Comparison
- Balance Sheet Detail
- Business Snapshot
- Profit and Loss as % of Total Income
- Profit and Loss Comparison
- Profit and Loss Detail
- Profit and Loss Year-to-Date Comparison
- Profit and Loss by Customer
- Profit and Loss by Month
- Profit and Loss by Tag Group
- Profit and Loss
- Quarterly Profit and Loss Summary
- Statement of Cash Flows
If you have created a budget and have the correct subscription level, you will also have Budget Overview and Budget vs. Actuals here.
Who Owes You
After the Business Overview section is the Who Owes You section. Here you can see charts such as:
- Accounts Receivable Aging Detail
- Accounts Receivable Aging Summary
- Collections Report
- Customer Balance Detail
- Customer Balance Summary
- Invoice List
- Invoices and Received Payments
- Open Invoices
- Statement List
- Terms List
- Unbilled Charges
- Unbilled Time
Sales and Customers
After the Who Owes You section is the Sales and Customers section. You will find reports for:
- Customer Contact List
- Deposit Detail
- Estimates & Progress Invoicing Summary by Customer
- Estimates by Customer
- Income by Customer Summary
- Inventory Valuation Detail
- Inventory Valuation Summary
- Payment Method List
- Physical Inventory Worksheet
- Product/Service List
- Sales by Customer Detail
- Sales by Customer Summary
- Sales by Customer Type Detail
- Sales by Product/Service Detail
- Sales by Product/Service Summary
- Time Activities by Customer Detail
- Transaction List by Customer
- Transaction List by Tag Group
What You Owe
The next section is called What You Owe. The reports here include:
- 1099 Contractor Balance Detail
- 1099 Contractor Balance Summary
- Accounts Payable Aging Detail
- Accounts Payable Aging Summary
- Bill Payment List
- Bills and Applied Payments
- Unpaid Bills
- Vendor Balance Detail
- Vendor Balance Summary
Expenses and Vendors
The following section is for Expenses and Vendors. The reports here include:
- 1099 Transaction Detail Report
- Check Detail
- Expenses by Vendor Summary
- Open Purchase Order List
- Open Purchase Order Detail
- Purchases by Product/Service Detail
- Purchases by Vendor Detail
- Transaction List by Vendor
- Vendor Contact List
Sales Tax
The Sales Tax section has reports that include:
- Sales Tax Liability Report
- Taxable Sales Detail
- Taxable Sales Summary
Employees
The Employees section has reports for:
- Employee Contact List
- Recent/Edited Time Activities
- Time Activities by Employee Detail
For My Accountant
The next section is For My Accountant. You can find reports like:
- Account List
- Balance Sheet Comparison
- Balance Sheet
- General Ledger
- Journal
- Profit and Loss Comparison
- Profit and Loss by Tag Group
- Profit and Loss
- Recent Automatic Transactions
- Recent Transactions
- Reconciliation Reports
- Recurring Template List
- Statement of Cash Flows
- Transaction Detail by Account
- Transaction List by Date
- Transaction List with Splits
- Trial Balance
Payroll
The final category is Payroll. You can find reports such as:
- Employee Contact List
- Recent/Edited Time Activities
- Time Activities by Employee Detail
Exploring Standard Reports
Now that you've seen the reports that QuickBooks has to offer, you can start exploring them. To start viewing any report, click on its title. You can also search for a specific report by clicking in the search bar and typing in part of its name. When it shows up under the search box, click on it to view the report.
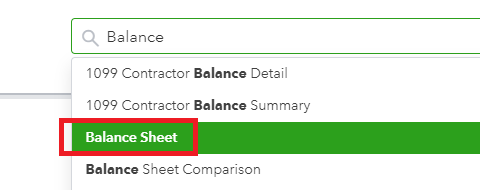
[Figure: Using the Search bar]
Once you click on the report, it will open up in a separate window. The top part of the window will allow you to customize the report, while the bottom part will show you the actual report.
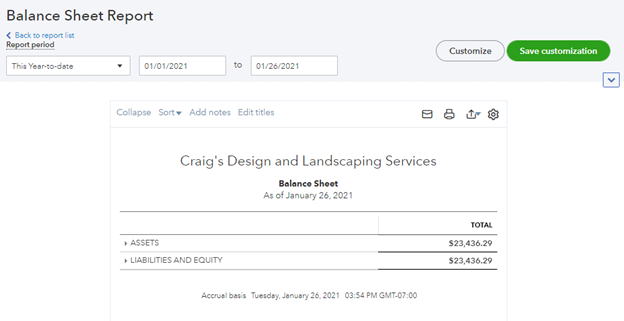
[Figure: A Balance Sheet report]
Customizing a Report
The default versions of each report you view may not have the exact information that you are looking for. Or, they could be too complicated for the audience that you must present the report to.
To address this, you can customize a report to your liking. At the top of the report's screen, you can first set the Report Period. You can choose from preset time periods, or enter the dates exactly.
The default time-period is This Year-to-Date. Other preset report periods include: All Dates, Today, This Week, This Week-to-Date, This Month, This Month-to-Date, This Quarter, This Quarter-to-Date, This Year, This Year-to-Date, This Year-to-Last-Month, Yesterday, Recent, Last Week, Last Week-to-Date, Last Month, Last Month-to-Date, Last Quarter, Last Quarter-to-Date, Last Year, Last Year-to-Date, Since 30 Days Ago, Since 60 Days Ago, Since 90 Days Ago, Since 365 Days Ago, Next Week, Next 4 Weeks, Next Month, Next Quarter, and Next Year.
You can expand or collapse the top customization menu with the dropdown arrow under the Save Customization button. When expanded, you can see more options.
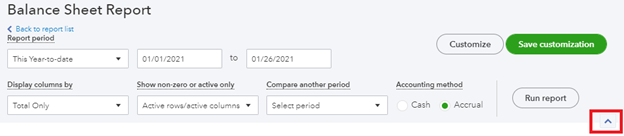
[Figure: Expanding and collapsing options]
The additional options here can change depending on the type of report that you run. Some things you can typically change include how you display columns by, whether to display columns or rows without values, whether to compare to another time period, and whether to use a cash or accrual accounting method.
Once you have made your changes, click on the Run Report button to see the new report.
You can also make changes to the generated report. Directly above the report is a menu bar that can change based on the type of report generated.
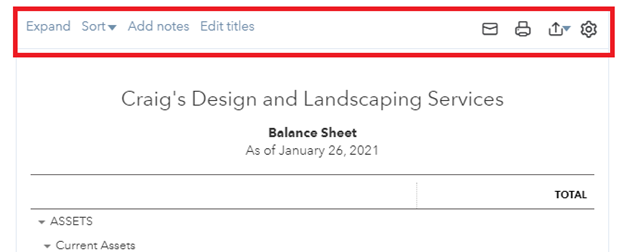
[Figure: Options at the top of a report]
The first thing you can do is expand or collapse the report. This will remove some layers of detail from your report if it is too long. You can experiment with this to see if it removes too much essential information.
You can also change how the information in the report is sorted. The ways in which you can sort the data change by type of report. You can also decide if you want to sort in ascending or descending order.
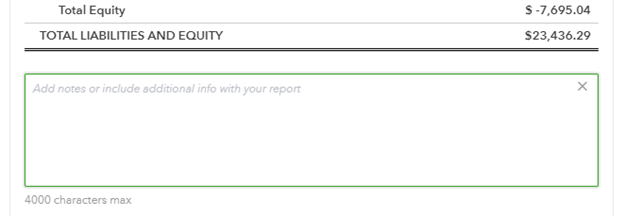
Clicking on the Add Notes text will open up a text box at the bottom of the form where you can add special notes about the report.
[Figure: Adding notes to a report]
Additionally, you can change the titles in the report. Clicking on the Edit Titles link will open up a window where every title in the report is editable.
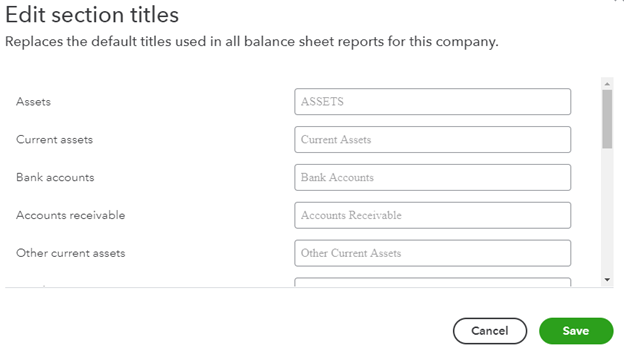
[Figure: Editing section titles in a report]
The business name and report title are also editable if you click on the pencil icon that shows up when you hover near them on the report.
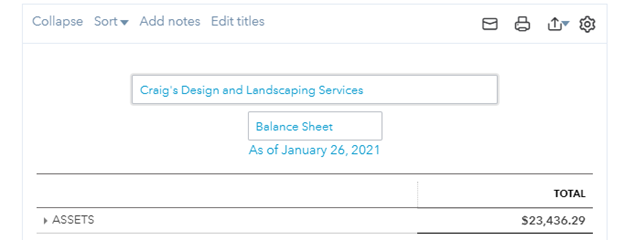
[Figure: Editing the business name and report title]
There are also four icons at the top right that allow you to email, print, save, or change settings. When you email, print, or save, it will use the report as you see it. So, if you have expanded or collapsed a section by clicking on one of the dropdown arrows by a section, it will use that view when performing the function.
The settings icon will allow you to change various display settings based on the type of report that you have generated. Some things that you can change include the visible columns and the display density so you can save space.

[Figure: Changing the report settings]
You can also reorder columns on certain reports. Clicking this link will pop open a side panel where you can drag and drop to reorder the columns.
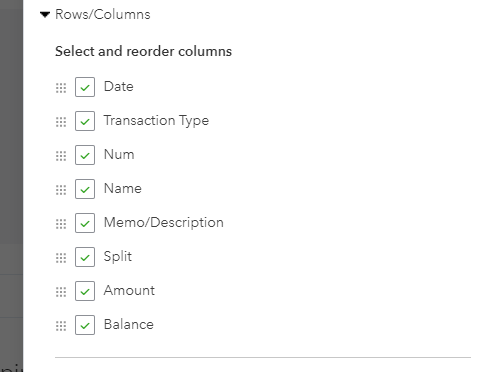
[Figure: Reordering the columns]
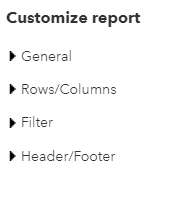
In addition to all the ways to customize that we've seen, you can also customize even more by clicking on the Customize button at the top. This will slide in a panel where you are given more customization options. These options are in four categories: General, Rows/Columns, Filter, and Header/Footer.
[Figure: Further customizations]
The General category has many of the same options regarding time periods and accounting method. Additionally, you can make choices about number formats such as to divide by 1000, not include cents, and how to show negative numbers. Negative numbers can have the negative sign before or after the number, or they can just be shown in parenthesis.
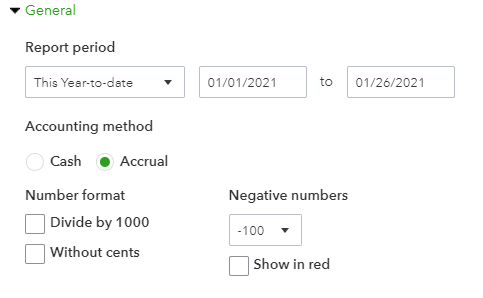
[Figure: General customizations]
In the Rows/Columns section, you can choose with rows and columns are viewable as well as in what order. This is the same menu as appeared before when reached through the gear-shaped settings icon above the report and then clicking on Reorder Columns.
In the Filter category, you can check which data to filter out depending on the type of data in your report. Check the boxes for fields you want included in your final report.
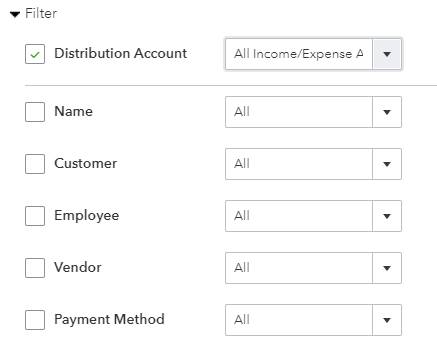
[Figure: Filtering out data]
In the last category, you can change header and footer information. It includes not only the data, but also text alignment.
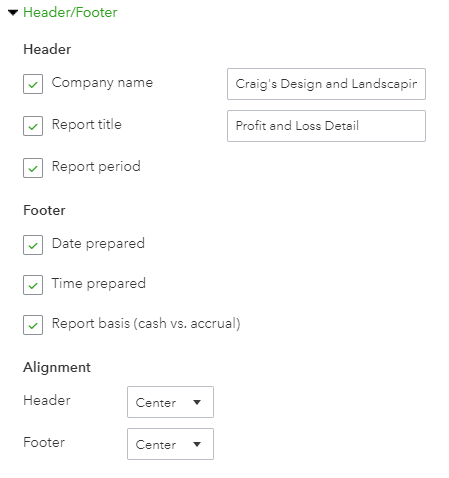
[Figure: Customizing the header and footer]
When you have finished customizing, click the Run Report button at the bottom to generate the report again.
Saving a Customized Report
After making all of your customizations, you can save your changes so that you don't have to redo them in order to get your settings again. To do so, click on the Save Customization button which is next to the Customize button. A window will pop up where you have some options for saving.
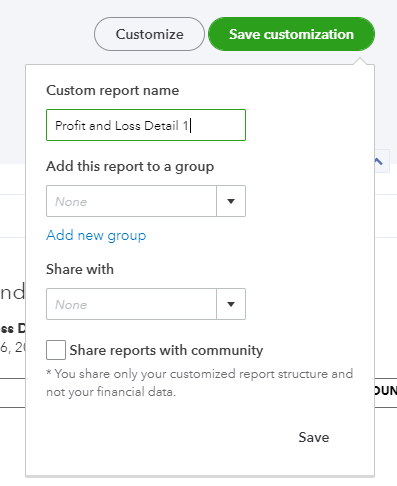
[Figure: Saving a customized report]
In this window, you can make a name for the report as well as organize it into a group. To make new groups, click on the Add New Group link. You can also share your settings with others. Click on the Save button to finish saving the customized report.
Viewing a Customized Report
You can view the customized report that you just made by going back to the Reports page and clicking on the Custom Reports tab. If you haven't created a customized report yet, the table will be empty. If you have already saved a customized report, you will see it in the table.
The table has columns for the report name, who created it, the date range, when it gets emailed, and an action column for performing functions. The Action column has an edit function as well as a dropdown that lets you export as a PDF, export as Excel, or delete the custom report.
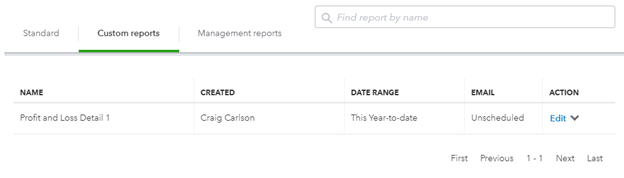
[Figure: Viewing custom reports]
You can view the customized report by clicking on its name.
Editing and Scheduling a Customized Report to Be Emailed
Clicking on the Edit link in the Action column will take you to a page where you can edit the report name, add it to a group, share with others, or set an email schedule.
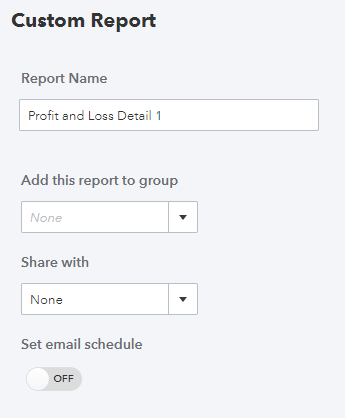
[Figure: Editing the customized report]
Toggling the Set Email Schedule switch will open up a form where you can schedule the report to be emailed. You can set the recurrence to be daily, weekly, monthly, or twice a month. You can also set the days you want the emails to be sent and when to stop.
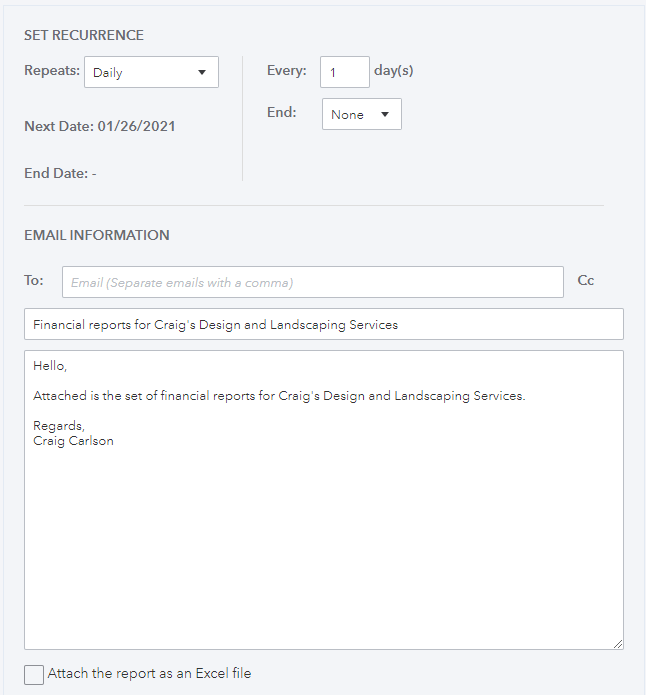
[Figure: Options for automatically emailing the custom report]
In the Email Information section, you can specify the recipients and enter a customized subject and message body. To also attach the report as an Excel file, check the box at the bottom.
When finished, click the Save and Close button at the bottom. When you return to the Custom Report page, you will see that the Email column will have a schedule in it.
Management Reports
The third tab on the Reports page is for Management Reports. It has three predefined reports in the list: Company Overview, Sales Performance, and Expenses Performance. These reports each are a set of other reports that are presented with a cover page and table of contents so that they look professional.
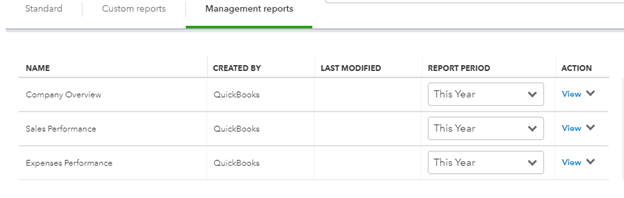
[Figure: Management reports]
The Company Overview management report includes the Profit and Loss report and the Balance Sheet report.
The Sales Performance management report has the Profit and Loss report, the Accounts Receivable Aging Detail Report, and the Sales by Customer Summary report.
The Expenses Performance management report consists of the Profit and Loss report, the A/P Aging Detail report, and the Expenses by Vendor Summary report.
Clicking on the View link in the Action column will open a Print Preview screen where you can see how the report looks. The other options in the Action column dropdown are to edit, send, export as PDF, export as DOCX, and copy.
Customizing Management Reports
To customize a management report, click on the Edit link from the Action column's dropdown. This will open a new form where you can customize various aspects of the report. There are categories for customizing the cover page, table of contents, preliminary pages, reports, and end notes.
[Figure: Customizing a management report]
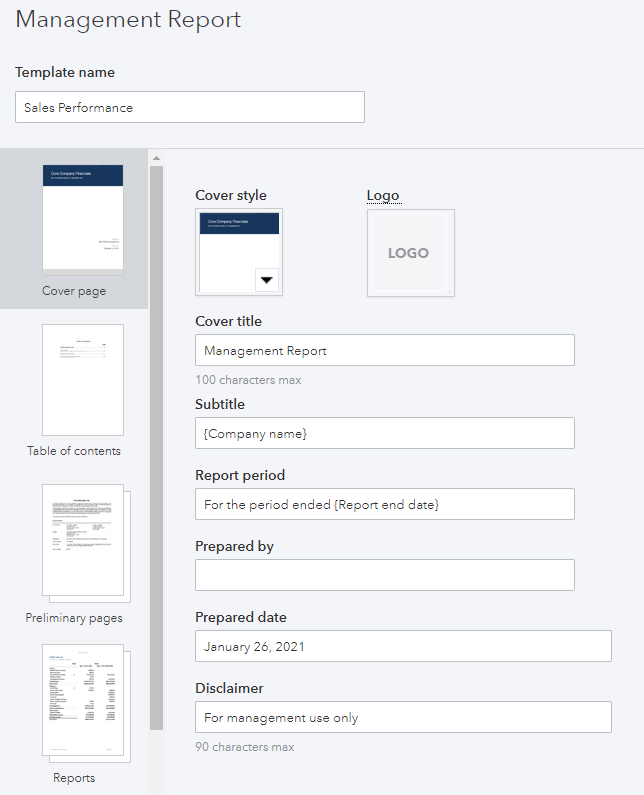
For the cover page, you can choose from four different styles and also include your company's logo. Also editable are the cover title, subtitle, report period, who it was prepared by, when it was prepared, and a disclaimer. Variables that are supplied by QuickBooks Online appear with curly braces, such as {Company name}.
For the table of contents, you can choose either enable or disable it from the checkbox at the top. You can also choose to rename your table of contents to something else.
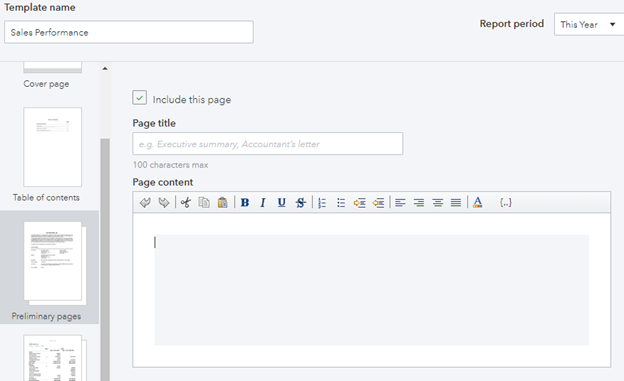
In the preliminary pages, you can add some extra pages to your report. A text editor appears here where you can apply some formatting to the pages you want to include.
[Figure: Adding preliminary pages to a report]
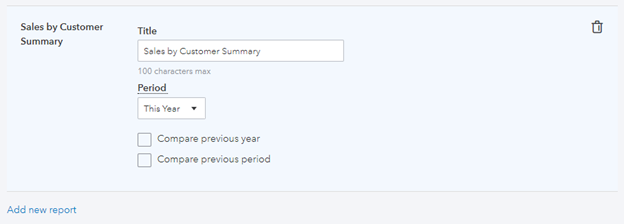
In the reports section, you can make some edits to the data shown in each report. Click on the pencil-shaped edit icon and you will see options such as changing the title, period, and whether to compare with the previous period or year, depending on the type of report. You can also remove the selected report from the management report by clicking the trash can-shaped icon.
 [Figure: Editing a report in the management reports]
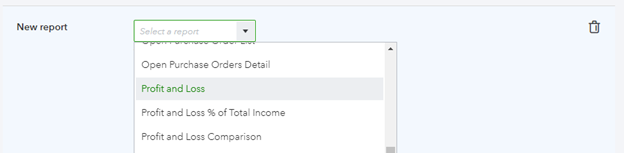
At the bottom of the screen, you can add more reports to this management report by clicking on the Add New Report link. That will add a new row where you can select your report from a dropdown menu.
[Figure: Adding a new report to a management report]
The last category is for adding end notes. Here you can decide whether or not you want to include this page. You can further include breakdowns of sub-accounts that are line items. You can also make a page title and fill in the page content in the text editor window.
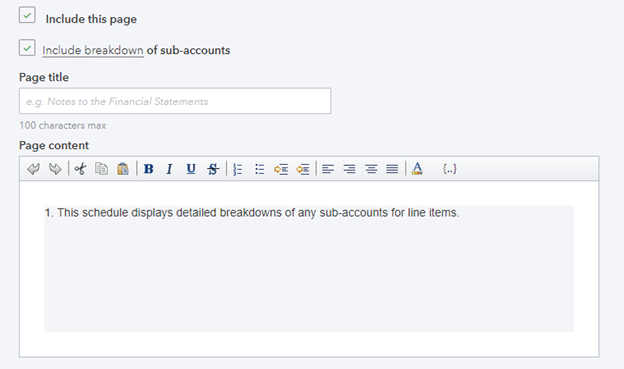
[Figure: Customizing end notes in the management report]
Once you've finished customizing your management report, there are a few things you can do with it from the buttons at the bottom of the page. You can preview and print from the Print or Preview button at the bottom. If everything is filled in correctly, the report will load up as a PDF to print.
At the bottom is an Advanced button where you can set a few more options. Clicking this will pop open a window where you can see fields which you can insert into your header or footer. Fields are variables enclosed in curly braces. The fields available by default are {Company name} and {Report end date}.
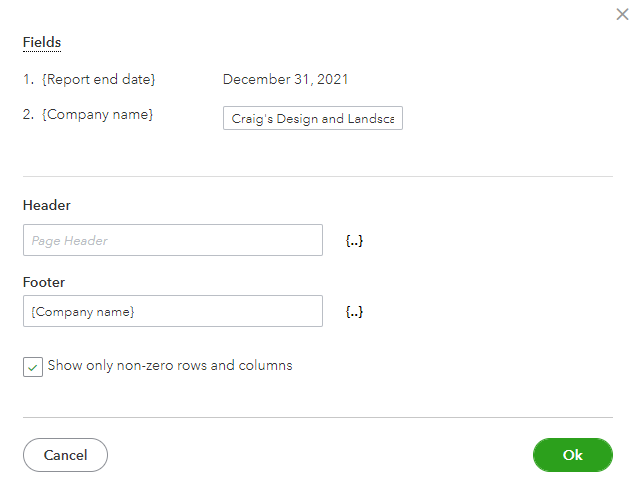
[Figure: Advanced settings in management reports]
Lastly, you can click the Save and Close button to finish with your management report. Your new management report will show up in the table under the Management Reports tab.
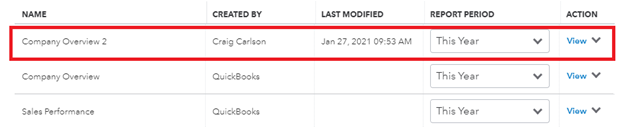
[Figure: A saved management report]
Conclusion
In this article, you learned all about reports. You saw all the reports that are made available to you by default and also learned about customizing your own reports. You also saw how to retrieve management reports and customize those as well.