Key Definitions
1. Cycle time � This is the time required to perform a repetition of a certain job, usually measured from start to start; from start of the processes on a given machine, till the start on the next one on the same machine.
2. Manual cycle time � This is the time taken turning or flipping parts, loading, unloading or adding elements to sections while still in the same process or machine.
3. Machine cycle time � This is the processing duration of a machine working on a product.
4. Auto cycle time � This is the duration a machine operates unguided or without human intervention.
5. Overall cycle time � This is the whole duration taken to make a single unit of product.
6. Total cycle time � This includes all processes, machines as well as classes of cycle time via which a product must go through to become a final product.
There are seven Non Value Adding or Wasteful activities or processes that a lean manager need to eradicate, and outlined lean management techniques that can help managers inspect and identify these waste. The seven wastes are: waste of overproduction, waste of waiting, waste of conveyance, waste of over-processing, waste of inventory, waste of motion, and waste of correction. In this article, we will look at lean production practices that can be implemented within an organization's current operations system to eradicate these activities.
Lean Production Technique
There are six practices of Lean Production:
1. Standard work
2. Error proofing
3. Total production maintenance
4. Visual management
5. Fast changeover
6. Total quality and quality control tools
1. Standard Work
Standard work is used to reduce or eliminate wasteful activities. Basically, standard work means establishing and complying with a specific level of quality within which work must be performed. The other way of thinking about standard work is that tasks must be performed to a specified level of specification. The specific benefits of standardizing business operation are;
� Reduced costs
� Increased productivity
� Waste elimination
� Stabilized workflow
� Simplified processes for current and new employees
Establishing standard work is not hard, provided the following objectives are fulfilled:
1. A standard is designed for the job.
2. Processes, as well as employees, comply with the designed standard.
Designing good standard work entails three main components:
3. A Takt time (a work rate).
4. A work sequence.
5. Enough resources for continuous workflow.
Before Standard work is executed, it needs to be confirmed to be fair and rational by all the people involved in the affected processes and steps, be known by the employees and the managers, and win organizational commitment to maintain it. Once the standard work has been attained, it is important to constantly monitor its efficiency and gradually improve it.
Prerequisites of Standard Work
There are two prerequisites for designing standard work. These are;
1. A stable process � Standardizing require consistent or stable processes, i.e., stable material, workforce, and equipment. For example, in wineries, grape variety and seasonal changes does affect the volume of work, but not the stability of the wine production process. Wine producers maintain a standard pattern regardless of these small variations.
2. Leadership Requirements� Standard require that the following four leadership pre-conditions be fulfilled before they can be executed:
a) The management must foster a finger-pointing free culture � This does not mean people should not be held accountable, it means that management need to adopt a culture of suspending judgement and focus on understanding and resolving the problems affecting the process, before turning to the person. It involves creating and maintaining a work culture where employees feel empowered to take part in decision making, and are certain that their contribution is essential to attainment of standard work.
b) The management must commit to a culture of continuous improvement � this should originate from the top-level management.
c) Leaders must visit the work areas to know how work is done � Visual management controls give managers a quick understanding of organizational performance.
d) Employees and leaders must respond swiftly to problems and not delay in raising their problems.
Forms of Standard Work
There are three main categories of standardized work:
e) Type one � Repetitive single cycle process. For example, a robot or an operator packing at the packing level.
f) Type two � Short variable cycle. For example; large elements of classical production such as filtering, pumping, crushing, etc.
g) Type three � long cycle. For example; annual cycle of work that requires to be done from classical to classical production.
Understanding types of standard work facilitates selection of the right metrics, Takt time (work rate), adequate resources, and work sequence for a continuous workflow.
Examples of different types of Standards; Assuming a Winery
Example 1:
For bottling lines, typical type 1 activities in a winery, the probable standard are:
1. Bottles/minute.
2. A pictorial representation of the sequence of steps to be followed to complete the process.
3. Ensuring resources (wine, boxes, bottles and such) are available on need to facilitate completion of the process (and eliminate waiting time).
Example 2:
For a fully-fledged vintage, a classical type 3 activity, appropriate standards may include:
1. Average production rate per year
2. Site-wide inventory management
3. A high level guide of the wine making process.
Standard Work Tools
Standard work tools help to develop standardized work. They usually depend on each other and their aim is to produce a Standardized Work Instruction Sheet. The sheet forms a section of visual administration tools that assists both leaders and operators to maximize process efficiency and eradicate waste. Standard work tools include the following:
� Time observation record
� Standardized walk/work combination sheet
� Standardized work map
� Equipment process capacity table
� Standardized work instruction sheet
The relation between these tools is outlined in the figure below.
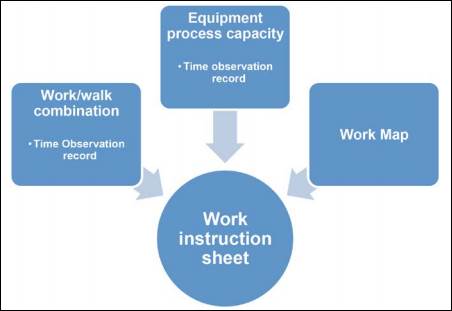
Figure 1: Standard Work Tool Relationship
The figure shows that the time observation sheet generates data for both the equipment process capacity sheet and the walk/work combination sheet. Work instruction sheet is made up of these 2 sheets together with the work map.
a. Time Observation Record
Recording process time is vital. Time records should be accurate since they form the foundation of standard work. Also, they are used to review process speeds before and after improvements. An observation record should be simple � just for recording useful figures for analysis. The figure below shows a time observation record:
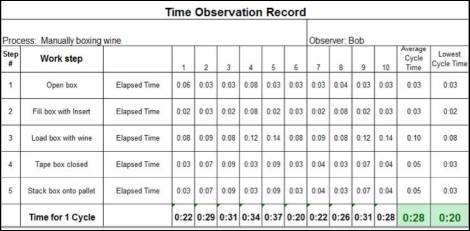
Figure 2: Time Observation Record
There are two main things that can be learnt from a time observation record:
1. The lowest cycle time
2. The average cycling time
Any improvement to the process lowers the total cycle time.
b. Standard Walk/work Combination
A standard walk/work combination table combines machine processing time, walk time, and work time for the operator in the process. This gives a summary of the exact time needed to complete a given process and it can be displayed graphically as shown in the table below.
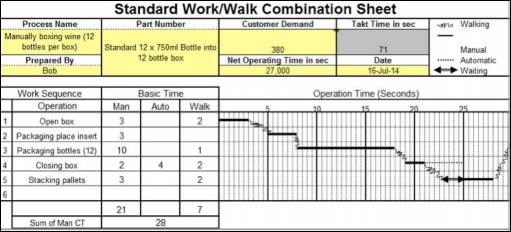
Figure 3: Standard work/walk combination sheet
Once the combination sheet is completed, it allows the jobs to be combined to increase efficiency. The sheet offers a visual management guide so that the operators can know how long the process should take and the steps involved in the process. Also, it provides a visual aid for managers to make sure that the steps are being followed appropriately.
c. Standard Work Map
Standard work map depicts material allocation and operator movement in relation to the process and machinery layout. The figure shows an example of a standard work map:
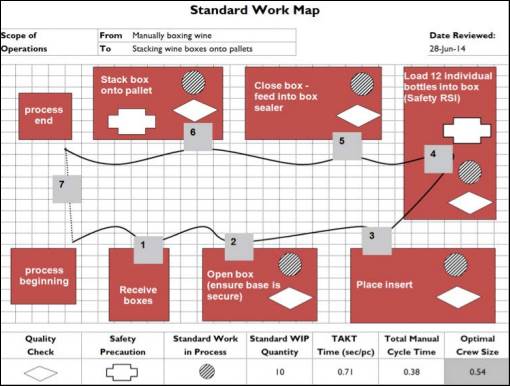
Figure 4: Standard Map
Work in Progress = (Automatic cycle time + Manual cycle time) � Takt time
If WIPC is equal to one � the cycle time is equal to the required production rate from the client.
If WIPC is greater than one � it shows that there are bottlenecks and the rate should be increased through addition of employees or reduced cycle times.
If WIPC is less than one � It shows that the process is faster than the needed rate. This is also a problem because one sector would need to store goods as it waits for the next process to complete. The rate should be reduced.
Standard work maps should be displayed at workplaces as visual tools to provide guidance on the best (economical) way to perform a task. Standard work map should be reviewed regularly and updated to align them with changes in the workplace.
d. Equipment Process Capacity Table
One of the most important requirements of standard work is to determine the capacity of tools or equipment associated with a process. This aids to compute the actual process capacity, identify tailbacks and if possible, enhance the capacity. Here is an example of an equipment process capacity table:
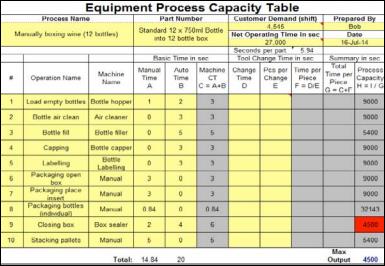
Figure 5: Equipment Process Capacity table
The capacity sheet is generated from the time observation record. The table records both the direct operation and the equipment time excluding walk time.
e. Standard Work Instruction Sheet
As we said earlier, the standard instruction sheet is generated from the above sheets. It is illustrated as follows:
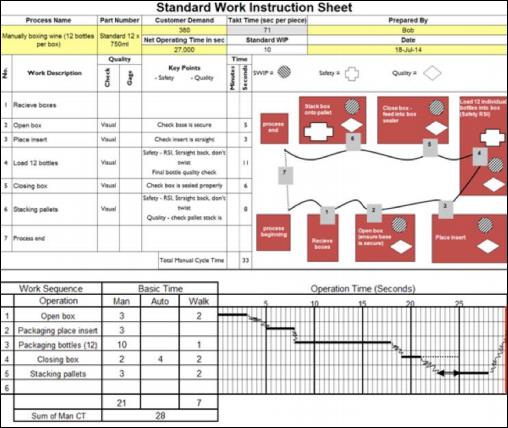
Figure 6: Standard Work Instruction Sheet
Standard Work Instruction Sheet offers the perfect visual management instrument for both leaders and operators to make sure business processes are being followed to the standard. It is a one-stop shop for leaders to ensure that the specified work steps are being followed, and for operators to understand business processes. Additionally, it offers an opportunity for all employees to enhance the current workflow and boost efficiency.
Error Proofing
Error proofing involves designing and deploying fail-proof systems to caution business problems from different problem such as producing defective products. The concept behind this practice is that even minimal defects are not acceptable. The simplest way to prevent defects is to avoid mistakes, right from the start of the production process. Therefore, error proofing is a form of inspection at the initial stage as opposed to inspection of the finished product at the end of the manufacturing process.
This ensures that resources are not wasted on defective products as they are spotted before the process goes further, to produce a finished, but sub-standard product does not deliver the requested value by the customer. Organizations should strive towards prevention as opposed to detection. Error proofing helps to reduce the following types of waste:
� Waste of waiting
� Waste of inventory
� Waste of motion
� Waste of correction
� Waste of transportation
� Waste of over processing
� Waste of overproduction
Three-step Process of Analysis
When considering designing and implementing error proofing mechanisms, managers should identify if it is profitable to error proof the systems, or not. Not every process need or can be error-proofed. Normally, a three-step process is used to find out whether there is the need for error proofing and the optimal type of error proofing. The analysis involves the following steps:
a. Identification of the need
b. Identification of probable mistakes
c. Management of mistakes before the need is satisfied
Conducting this analysis allows methods to be implemented to evaluate the need as well as the control for the situation. Error proofing should be related to the degree of the risk.
Total Productive Maintenance
Total productive maintenance or TPM is simply a set of techniques that ensure that machines or devices in the production process are able to execute their tasks. TPM is used to reduce or lower these forms of waste:
� Waste of inventory
� Waste of waiting
� Waste of motion
� Waste of transportation
This technique involves getting all the employees in an organization to commit to maximizing their machine running time. TPM is not just a way of maintaining good schedules, but also a method of boosting process efficiency and minimizing downtime and waste.
The main objective of TPM is to improve employees' morale, job satisfaction and volume of production. It has a simple rule which states that "TPM does not accept the machines will inevitably fail." There are five benefits that organizations can reap from TPM:
a. Operators become equipment maintainers
b. Maintainers become improvers
c. It reduces waste and downtime
d. It reminds that equipment should not fail
e. Reduction in the total life cycle costs of machine
Elements of Total Productive Maintenance
TPM consists of these elements:
a. Total staff participation � This means that maintenance does not fall down to just the maintenance personnel, but also to engineers, managers, operating staff, etc.
b. Improvement role � This means that professionals are mainly required in advanced roles.
c. Increased education and training � This is vital for both retaining and developing good employees.
d. Planned maintenance � This prevents situations from becoming catastrophic or having excessive downtime.
e. Autonomous maintenance � Total staff participation also involves ensuring that systems are well lubricated, cleaning and basic housekeeping.
Visual Management
Visual management is a general term that depends on the fact that individuals generally understand visual instructions better than plain text. Simple data displayed visually is more likely to be analyzed by employees than complicated data. Managers can use visual management to reduce different types of waste including:
� Waste of inventory
� Waste of overproduction
� Waste of waiting
� Waste of transportation
� Waste of motion
� Waste of over processing
� Waste of correction
Visual management eradicates the clutter and assists people to make clear and informed decisions on the process needed for the task at hand.
Benefits of Visual Management
The main benefits of visual management are:
a. Highlighting important information in a way that it cannot be ignored.
b. Help to expose, prevent, as well as eliminate waste.
c. Increase a firm's profitability.
d. Extensively reduce the time required to understand concepts or information.
e. Prevent information cluttering so workers can see their outcomes.
Most standard tools and techniques are visual management guides. They are presented with the aim of visually helping or guiding an operator's workflow as well as time to complete tasks. In addition, visual management allows team leaders to ensure that tasks are being executed to standard and to find ways to enhance the processes.
Although visual management can be as simple as looking for the green light in a traffic situation, it should not be overexposed to the employees as they can get lost in the information. Too much of anything is poisonous. The primary goal of visual management is to simplify information to allow people to work efficiently.
Visual management is related to other lean management practices such as 5S and lean thinking. For instance, visual management workflows can help improve and maintain 5S performance.
NB: there are no fast or hard rules for visual management workflows, they are only there to offer employees the information they require to understand their job better.
Fast Changeover
Fast changeovers are processes of converting lines, tanks or machines from running one produce to another. Changeover times may last for a short time (like minutes) to a long time (several weeks) primary depending on the process involved. The aim of reducing, changeover time, is to allow for more regular changeovers, not to boost productivity capacity. This boosts production flexibility. Fast changeover is often used to remove or reduce these kinds of waste:
� Waste of waiting
� Waste of transportation
� Waste of inventory
� Waste of motion
Benefits of Fast Changeover
Fast changeover has the following benefits:
a. Lead time reduction � This means that products can be manufactured in a very short time when a customer places an order. This saves storage cost.
b. Lot sizes reduction � When the changeover is fast, machines can be switched from one task to another with minimal time loss. This is very useful when a customer wants different varieties of goods.
c. Increased flexibility � A dynamic machine can cope with changes or switches more easily than a stationary one. This can increase performance.
d. Inventory reduction � Products are produced only when they are demanded and thus inventory changeover boosts production flow leveling.
e. Increase production flow leveling � this is because the processes are less interrupted and are more constant.
Ensuring Fast Changeover
How do you ensure fast changeover? Fast changeover can be achieved through these steps:
a. Machines should always be working (no idle machines).
b. The perfect setup time is to have no setup time.
c. Tools required for changeover should always be ready for use.
d. There should be enough employees to reduce changeover time.
e. The goal of all team members should be to reduce setup time.
f. If it is safe and possible, initiate changeover when the machine is still running.
Guide Line for Fast Changeover
The following guidelines can help to increase the rate of changeover:
a. Identify internal setups � internal setups are steps undertaken when machines stop working. If possible, they should be changed to external setups or lower the time the machines will be idle.
b. Eliminate non-essential operations � for instance, instead of replacing the whole guard rail in a machine, replace just the broken side.
c. Execute external setup � this might include getting guides, staff and tools ready for changeover and making sure that all equipment are ready and present.
d. Simplify internal setup � it can include changing screws in a machine.
e. Measure � the easiest way to know if setup time has increased or decreased is to measure the rate of the new process.
Quality Control Tools
Quality is delivering goods that clients will buy at optimal cost effectiveness. It is not just about inspecting products at the final stage of production, but it is a combination of tasks during the production process that leads to quality. Organizations need to commit to constant improvement in order to reap the benefits of quality. Quality control reduces costs as there is no need for rework. In general, quality control can reduce these kinds of waste:
� Waste of inventory
� Waste of overproduction
� Waste of motion
� Waste of waiting
� Waste of over processing
� Waste of correction
� Waste of transportation
When quality control measures are implemented in all areas of a firm, it is known as Total Quality Management. A vital step in quality control is to collect data so that performance can be managed, measured and communicated. Data should be visually communicated through the following ways:
a. Graphs � Graphs offer visual display which compares different values and they are easier to interpret.
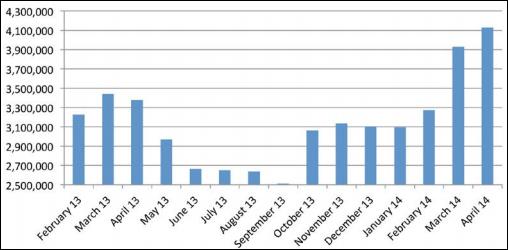
Figure 7: Example of a graph
b. Checklists � Checklists help to arrange or manage data and review it.
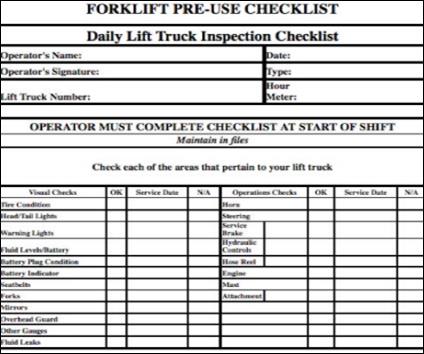
Figure 8: Example of a checklist
c. Fishbone diagrams � They are used to understand both the cause and the effect of a process. They also classify causes in six forms: process, equipment, material, environment, people or management.
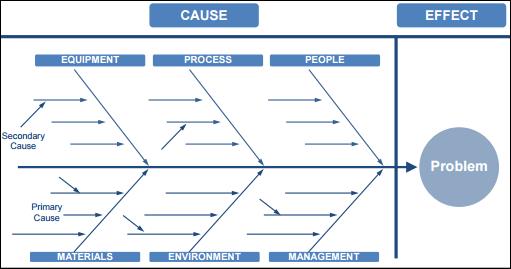
Figure 9: Example of a fishbone diagram
d. Scatter plots � They compare different variables data sources.
e. Histograms � they provide a frequency or count for a measured parameter.
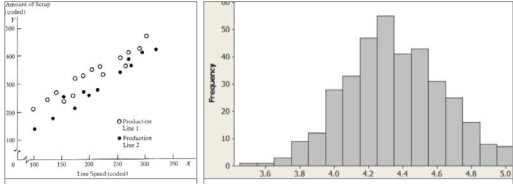
Figure 10: Example of a scatter diagram and a histogram
f. Control chart � It allows the operator to understand the current value and if it is within the control limit.
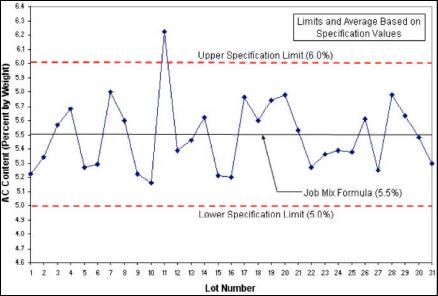
Figure 11: Example of a control chart