Key Definitions
1. Six Sigma � A Data-driven method or approach for eliminating waste in an organization process
2. SAP � A software firm that allows organizations to manage customers' relationships and business operations.
3. Brainstorming � A group creative technique through which efforts are put to find the best solution for a certain problem through gathering a list of ideas contributed by group members.
4. Parameter � A measure or numerical factor that sets the condition for implementation.
5. Lean � An approach to running a firm that support the idea of continuous improvement.
Introduction
PDSA was invented in 1920 by Mr. Walter A. Shewart, a statistician and one of the founders of the famous Bell Laboratories in New York. Walter introduced the notion of Plan, Do, and See. In the 50s, Edward W. Deming, a Total Quality Management guru and a well-known statistician, modified the cycle to: Plan, Do, Check, and Act.
Definition
PDCA Cycle, also called the PDSA or Deming Cycle, is a quality improvement system made up of a logical series of four recurring steps geared towards realizing continuous learning and improvement within an organization. It is a tool for implementing change in an organization. Just like a circle, PDSA is a never ending process leading to continuous improvement within the organization. The 4 steps of PDCA are:
|
Plan
Tools:
|
Do
Tools:
|
|
Check
Tools:
|
ACT
Tools:
|
Benefit of Using PDCA
Unlike the human intuition, PDCA offers a systematic way of knowledge acquisition and implementing change. Adopting the PDCA cycle increases employee's process knowledge, widen-decision making options, and boosts the probability of sustainable long-term progress. Its key benefits over the human nature are highlighted in the table below:
|
Human Nature VS PDCA |
|
|
Human Nature |
PDCA Cycle |
|
Get straight into the solution mode |
Allow time to plan |
|
Fight the problems all the time |
Involve the right people |
|
No real understanding of the problem |
Has a structured system of defining problems |
|
No evaluation if the solution is effective |
Test and review solutions to ensure objectives are met |
When to Use PDCA
-
As a tool for Kaizen � Continuous improvement.
-
When beginning an improvement project.
-
When designing a new or improved project.
-
When designing a repetitive work progress.
-
When implementing change.
-
When planning data analysis and/or collection in order to prioritize and verify root causes or problems.
Implementing the PDCA Cycle
PDCA implementation is a 12 step cycle � see the diagram below:
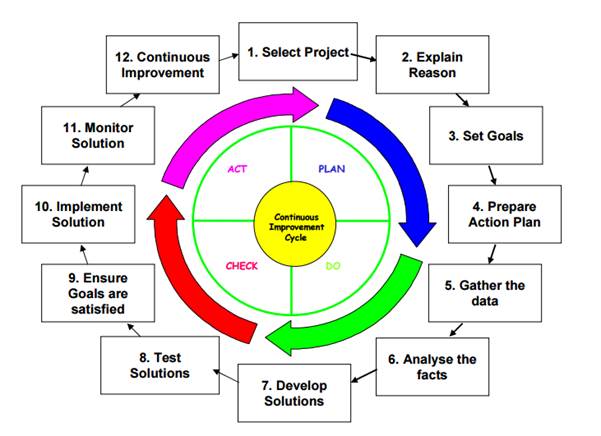
The PDCA 12 Steps Explained
STEP 1: Select Project
Choose the project that needs improvement and develop a clearly defined process improvement goal. The project improvement goal may come from the people who manage the process, management, customers, or the PDCA team. Some parameters that can hint that a process needs improvement include:
-
Customer feedback.
-
Key performance indicators.
-
Focused improvement.
-
Risk Assessment reports.
-
IPT meetings.
Step 2: Explain the Reason
At this stage, the team leader should produce an agreed, well defined problem statement that gives stats and facts, but doesn't talk about possible countermeasures.
Illustration:
After process A has been completed, the operator is required to inspect the product, and then certify in SAP that the work has been effectively completed.
However, the operator on process B has been complaining that 30 percent of the time, products arrives without having the right certification, which stops his team from doing their job. He is forced to stop for about 3 hours to sort the problem.
Process B manager posits that the problem has escalated since they updated the SAP version from II to III. Therefore, the reasons can be explained as follows:
-
Every employee needs to be trained on SAP III.
-
More SAP III verification access is needed.
-
More employees are required on process A.
Step 3: Set Goals
Set SMART goal. For example, using the above example of process A and B:
To identify and adopt the requirements that will ensure that 90 percent of products arriving at process B have completed verification by the end of the next six months, rising to 100 percent by the end of the year.
Step 4: Action Plan
Develop a specific action plan to guide implementation. The aim is to ensure that the plans are time-bound and implemented by the right individuals. Consider the following questions:
-
Why is the project being implemented?
-
What data is needed? What is going to be done?
-
Who should be involved? Who is responsible for different tasks?
-
How do we review? How will the project be accomplished?
-
Where will we find the right data and facts?
-
When should the task be completed?
Step 5: Gather the Data
Collecting data allows the team to understand the present situation and extent of the problem. Data gives the information needed to analyze an issue. It is vital to use the right tools to define your problem. Only then can the appropriate data be collected in the right form to enable solutions to be generated and their efficiency reviewed. Depending on the problem the PDCA team is trying to define, data can be collected in a number of ways:
-
Interviews.
-
Machine history.
-
Customers return data.
-
Visiting the workstation (Go and See).
-
Risk assessments.
-
Scatter diagrams, and check sheets.
Here are some factors you should consider when planning data collection:
-
What the problem the PDCA team needs to answer?
-
Which are the most suitable data collection tools to use?
-
Which the best way to communicate the outcome of the PDCA team?
-
Where and/or who in the process can provide the team with the required data?
-
How can the data be collected from that section of the process of from the individual with minimal error and effort?
-
What additional info is required for analysis?
Step 6: Analyzing the Facts
Data can be analyzed using scatter diagrams, check sheets, histograms (Data collection), flow charts, control charts (data collection and analysis), Pareto analysis, and cause and effect analysis (Analysis techniques).
The table below shows the most suitable tool to use for various problems:
|
Situation |
Most Suitable Tool |
|
Tracking OEE |
Control chart |
|
Most regular causes of downtime |
Pareto analysis |
|
Location of dispensations on a panel |
Scatter diagram |
|
Identifying probable reasons for poor delivery |
Cause and effect analysis |
|
Understanding process for changing tooling |
Flowchart |
|
Making sense of accident data |
Histogram |
Step 7: Develop Solutions
Based on the findings from the data analysis, develop countermeasure or solutions by brainstorming all the probable root causes of the problem. Note that the most viable solution is the one that not only solves the problem now, but prevents it from recurring.
It might be helpful to start with brainstorming, grouping the possible solutions, prioritizing, and then asking the 5Whys.
Here are a few tips for brainstorming:
-
First, have a clear and understand the objective.
-
Brainstorm as a group.
-
Have quality ideas not quantity.
-
Don't implement the ideas while brainstorming.
-
One person to write the ideas on a flipchart or board.
-
Piggyback off others ideas.
-
Think big.
-
Run every session for about 15 minutes.
-
Have a short break before you analyze the ideas.
Illustration: How to use the 5WHYs!
Q1: Why has the equipment stopped?
-
A: Overload tripped out.
Q2: Why did the Overload trip?
-
A: No oil on the shaft.
Q3: Why insufficient oil?
-
A: The oil pump is defective.
Q4: Why is the oil pump defective?
-
A: Worn pump oil shaft.
Q5: Why is the oil shaft worn?
-
A: Blocked oil swarf.
Step 8: Test Solutions
Once you have identified and prioritized the solutions, you need to test them to assess their effectiveness. Think about how you can review their success.
Step 9: Ensure Goals Are Attained
You need to assess the success of the solutions by comparing their impact with the goals you had set in step 3.
The figure below shows the entire PDCA Cycle.
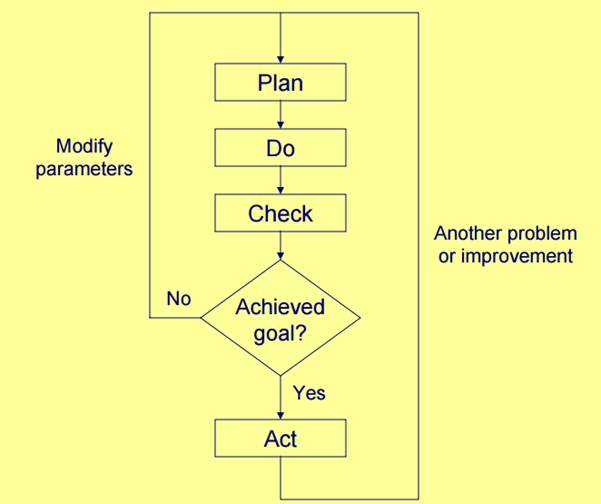
If the goals have been satisfied, the solutions can be adopted; if not, consider the following:
-
Is it possible to improve the current solutions?
-
Is it possible to develop additional solutions?
-
Are the goals appropriate or should they be redefined?
Note: Redefining your goals means a return to the third step.
Step 10: Implement Solutions
You should ensure that all measures are taken to ensure that the solution becomes a success and thus the new standard.
You need to remember the following:
-
If the goals are satisfied, then solution should become the new way of doing things
-
All the relevant people should be informed
-
Training need to take place � identified and addressed
-
The necessary documents need to be updated
-
Use the standard operating sheets to document the new standard
Step 11: Monitoring Solutions
Monitoring the solutions involves a continuous gathering of data as well as an analysis of the facts to monitor the efficiency of the adopted solutions. Repeat the fifth and sixth steps of the cycle to establish the before as well as the after situation of the firm.
Don't forget to share your findings. The people involved in the PDCA team as well as those working in the concerned process need constructive feedback after adopting the solutions to help them maintain a continuous improvement.
Step12. Continuous Improvement
Though defining the cycle of improvement, the standards of improvement keep on rising and never stop. You can use continuous process control measures to ensure that the performance of the solutions consistently satisfies the goals set. Improvement is infinite.
Summary of PDCA Cycle Implementation
Applying PDCA happens as follows:
1. Potential improvements are identified and analyzed, either because the employees have proposed a new way of doing things, because problems have been identified, because the market provides more effective machines that might save costs, etc.
2. The probable improvements, as well as effects, are studied. The organization chooses the improvements that can be successful and they decide to adopt them in a small-scale test program.
3. Once finished, the test program is evaluated to see if it is effective: Is it working correctly? Is it achieving the desired result? If the changes are not successful, the organization may decide to modify the process or design another one.
4. Finally, if the outcomes are satisfactory, the changes are implemented on a large scale in the organization.
Once the changes are fully implemented, production will be more effective and efficient.
Example of Businesses that Use the PDCA Cycle:
The art of solving problems is constantly being evolved and re-branded by people in different industries. However, although the new methods might be more effective in certain situations, PDCA remains one of the most trusted, and tested method of identifying and solving issues. The cycle is simple and practical enough to deal with different problems from the simplest to the most complex.
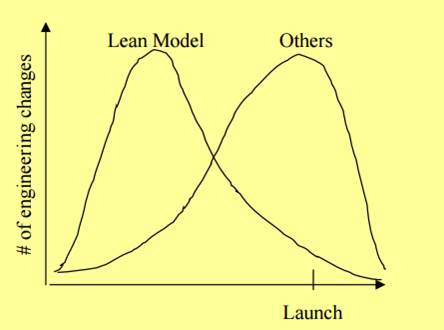
Case study 1: Toyota
One of the major firms that consistently use PDCA cycle is Toyota. Toyota has shown that a more effective and rapid use of the PDCA cycle result in a dramatic decrease in post launch engineering variations (see the graph below).
Case Study 2: Aluminum Foundry.
Another firm that has embraced the PDCA cycle is the Aluminum Foundry. The firm, a manufacturer of aluminum sand castings, performs PDCA on a yearly basis from bottom to the top. Tasks and metrics are developed to meet the set goals. Status of the metric is either green (effective), yellow (need improvement), or red (non-effective).
On a daily or weekly basis, different teams present their checks (metrics) and plans. These metrics are reviewed on a quarterly basis, and those that have failed are examined for root causes and new plans are developed to facilitate attainment of annual goals.