About Tables
If you've ever seen a spreadsheet, or used a program such as Excel, then you're probably pretty familiar with tables. That's all tables are, after all -- simply a grid arranged into columns and rows. You can use them to organize and emphasize certain pieces of information. More than that, you can use tables to do complex page layout operations that almost rival expensive professional publishing programs like Adobe InDesign.
Inserting Tables
Before we identify the different parts of a table, let's go ahead and insert one into our presentation.
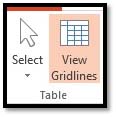
You'll find tables under the Insert tab in the Tables group. The Tables button looks like this:

Click the Tables button.
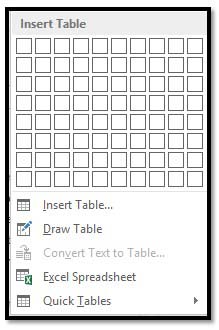
You'll see a bunch of boxes at the top.
The easiest way to insert a table is to drag your mouse over the rows and columns until you have the amount you want.
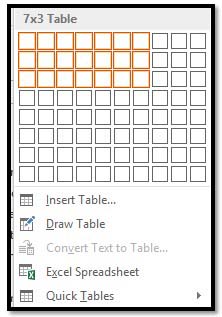
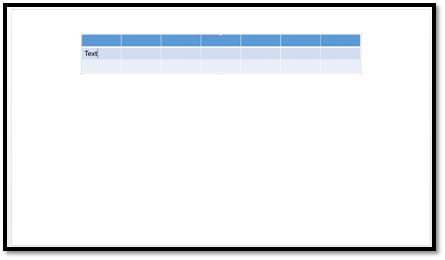
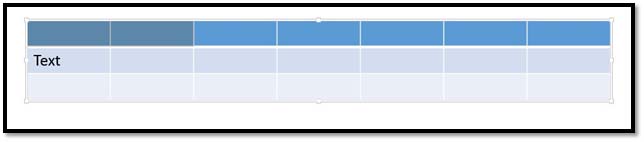
As you can see above, we dragged our mouse to make a table that has seven columns and three rows, or 7 x 3.
As we drag, the table appears on our presentation:
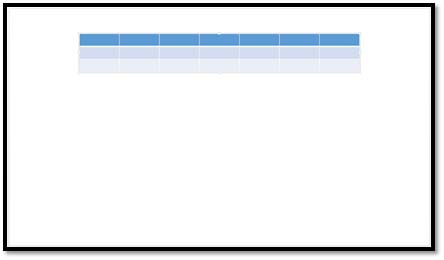
We now have a basic table. So let's identify the parts.
Each box that you see in a table is called a "cell." There are 21 cells in the table above.
The "rows" go from top to bottom. There are three rows. Rows go horizontally across the screen.
Columns go from left to right. There are seven columns above. Columns are vertical.
So now that we've identified the parts of a table, let's take a look at the other ways in which we can add them.
Using the Insert Table Dialog
Once again, we're going to add a table, but this time we're going to use a different method. Go back to the Insert tab, click the Table button, and select "Insert Table," instead of dragging your mouse over the boxes (which really represent cells, as we just learned.)
A dialog launches in the center of your screen. It looks like this.
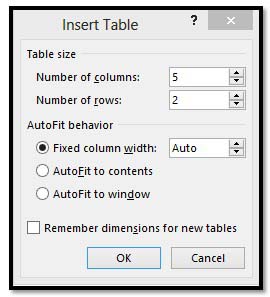
From here you can select the number of rows and columns. In this example, there are going to be five columns, and two rows. Select your preferences in the AutoFit behavior section. You can set a fit column width, make the width of the cells and table fit to the content, or make the table size fit to the window.
Click OK.
Drawing a Table
If you know your table is not going to be uniform (regularly sized columns and rows), you can "draw" a table. This is particularly helpful when using tables to create complex page layouts.
To do this, click the Table button and select Draw Table. Your mouse pointer will transform into a pencil tool and you'll be able to draw individual cells anywhere in your presentation. You can even draw cells within cells.
Click and hold the left mouse button, drag the cell into the desired size and shape, and then release. It's that simple.
Adding Text to a Table
Adding text to a table is as easy as clicking into a cell and then typing. You will be able to change any attributes of that text, too, and even apply a Quick Style, which adds effects to the text. You'll find quick styles in the Tables Design tab that appears when you add a table.
Position Text Within a Cell
Just like in an ordinary presentation, you can choose whether to center text within a cell, or whether to align it right or left, or toward the top or the bottom. Go to the Alignment group under the table Layout tab. This tab appears beside the Design tab.
You'll use these buttons:

As you can see, you can align text to the left, center, or right of a cell. You can also align it to the top, middle, and bottom of a cell.
Formatting Tables With the Table Tools
Whenever you create or select a table, the Table Tools will open automatically over the Design and Layout tabs in the tool bar. It allows you to easily apply table styles, borders, and shading attributes and more. Below is an example of the Design and Layout tools available for tables.
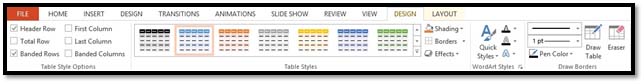
The Design tab (shown above) lets you customize the look and appearance of your table.
Let's look at the Table Style Options group. But first, look at our table below:
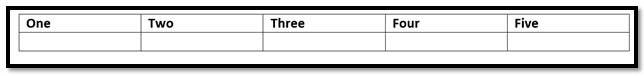
In the Table Style Options group, we see that Header Row, First Column, and Banded Rows are checked.
Let's learn what all these options mean so you can decide what you want checked � and what you don't.
- A Header Row is the first row in a table that contains headings (labels) for all the columns, as shown in our table above.
- When First Column is checked, it means the first column is also a header or a label. Same goes for the Last Column.
- You can also choose to have banded rows or columns. Banded Rows formats even and odd rows differently, so they are easier to read. If you choose Banded Columns, it formats even and odd columns differently.
- Total Row means to create a row for mathematical totals.
In the Table Styles group, you can pick a new table style or apply shading to your table by clicking the Shading button.
In the Borders group, you can use Border Styles to add borders to rows and columns to customize the look of your table.
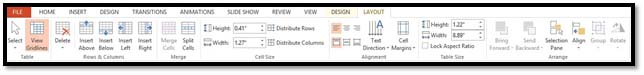
Now, let's click the Layout tab.
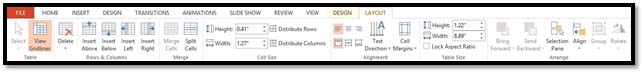
The Layout tab, when associated with the Table Tools, allows you to easily insert rows and columns, and to format text and objects within cells. You can also create new margins for your cells.
Selecting Cells, Rows, and Columns
Selecting cells, rows, and columns in PowerPoint 2013 is easy.
To select a cell, click within the cell so the mouse cursor is blinking.
Go to the table Format tab, then the Table group. Click Select>Select Cell
To select a row, click in the first cell in a row go to Select>Select Row.
To select a column, click the first cell in a column, then go to Select>Select Column.
Adjusting the Width of Individual Columns
There are several ways to adjust the width of individual columns:
- Position your mouse pointer over the edge of the column, and then drag it to the desired width.
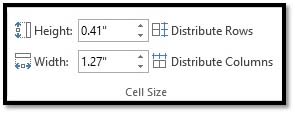
- Select the column, then go to the Layout tab, then the Cell Size group. Enter in a new width (in inches)
Adjusting Width of All Columns
To fix the width of all of the columns at once, select the entire table and use the Width box under the Layout tab to adjust the columns to the desired size.
You can also use the Distribute Columns button to make all of the columns the same size.
Adjust rows in the same way, except use the Height field.
Adding Rows and Columns
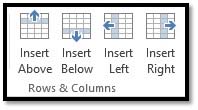
To add a row or column, select a cell, row, or column. Go to the Layout tab. Choose an option from the Rows & Columns group.
Deleting Cells, Rows, or Columns
To delete a Cell, Row, or Column, simply select it, navigate to the Layout tab, go to the Delete group, then select if you want to delete cells, rows, or columns, or the entire table from the drop-down menu.
You will then have the option of deleting a cell, a row, a column, or the entire table. You can also delete cells, rows, and columns by right-clicking inside a cell. In the menu, select Delete Cells. Click the appropriate command and click Ok.
Merging Cells and Splitting Cells
To merge cells, drag your mouse over the cells, while holding the left mouse button to select them.
As you can see above, the first two are selected.
In the Layout tab, select the Merge Cells button from the ribbon.  It is located in the Merge group on the ribbon. Or, you can select the cells you'd like to merge, and click the right mouse button. Select the Merge Cells from the menu.
 This button is also found in the Merge group. Choose the number of rows and columns you'd like to split the cell into, then click OK.
Charts and SmartArt
Using SmartArt and SmartArt Tools
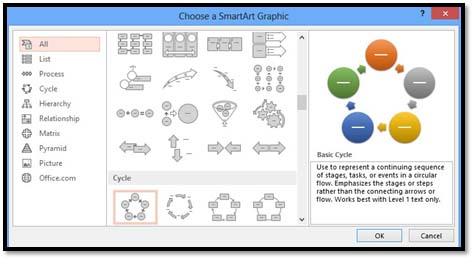
According to Microsoft, SmartArt is a quick and convenient way to create a visual representation of the information in your presentation. That's a mouthful, isn't it? What they really mean is it's a quick and convenient way to create flow charts. The following is an example of an available SmartArt template.

The SmartArt button is located on the Illustrations section of the Insert tab. 
Click it and a dialog box opens. It gives you different categories of SmartArt to choose. There are lists, processes, cycles, hierarchies, etc.
If you have access to Word 2013, take a moment to explore the different SmartArt graphics available in each section. Seeing them all for yourself will give you the best exposure to all of the possibilities. You can even click "Office.com" and find SmartArt graphics that were created by other Office users.
When you've found a SmartArt graphic that you like, select it and click OK.
When the graphic opens in your presentation, you'll also see the SmartArt Design and Format tabs.
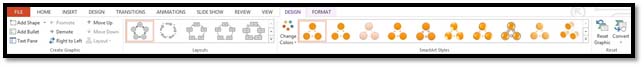
Use the Design tab to modify or edit the design of your SmartArt. Use the formatting tab to format it and make it look the way you want.
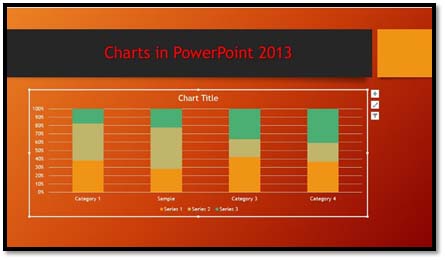
Inserting Charts
To insert a chart, navigate to the Insert tab and click the Chart button  . The Insert Chart dialog will open. It looks like this:
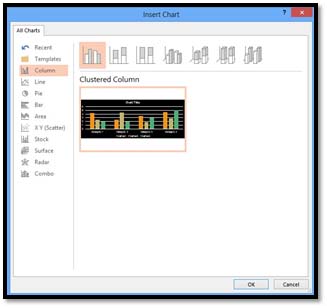
The chart types are arranged along the left side of the window.
Select the chart you want to use, then click OK.
If Microsoft Excel is installed on your computer, it will also open with your chart. You can input data into Excel, which will then be conveyed by your chart.
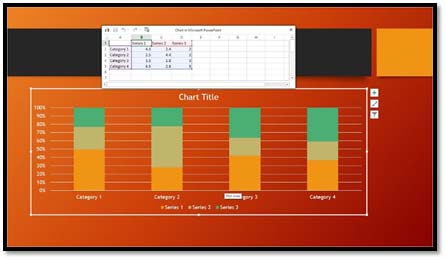
You can enter your data into the mini Excel spreadsheet, then X it out when you're finished.
If you want to go back and enter data later, click the Chart Tools Design tab, then Edit Data.
Using the Chart Tools
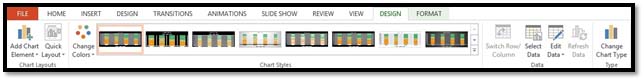
Whenever you insert a new chart into your presentation, the Chart Design and Chart Format tabs will open, as pictured below.
This is the Chart Design tab. By default, it's the tab you'll see.
You can also click on the chart Format tab, to the right of the Chart Design tab.
Let's take a look at the chart tools available on the Design tab.
Just like in the text ribbon, you have a choice of Chart Quick Styles. You can apply them just like you would with text, paragraphs, and pictures.
Use the Chart Layouts group on the Ribbon to add chart elements or change the layout.
Now look at the Type and Data Sections. The data section lets us select an existing data set, or edit one.
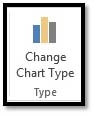
With these, we can change the chart type, switch rows to columns or vice versa, select, and edit data. Say, for example, that after we entered our data, we realized that maybe a pie chart wasn't the right way to convey it. We've decided instead to use a graph chart. To do so, we'd click the Change Chart Type button and select a new chart.
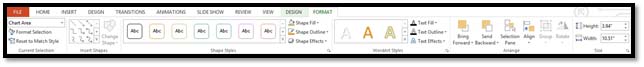
Now let's take a look at the Format tab for charts:
Use the Current Selection section to change the formatting of the current selection.
Use the Insert section to add and insert shapes. Use the Shape Styles section to change the style of your shapes. You can also change WordArt styles that appear in your chart.
The Arrange group lets you arrange your data and images, including text wrap and position.