Key Terms
Objectives
Introduction to Functions
In many situations in everyday life, we convert one set of numbers (which might even just be a single number) into other sets of numbers by performing some series of mathematical operations on it. For instance, we might want to convert a length measurement from feet to inches. If the measurement is 2 feet, then we multiply by 12 to get the number of inches. More generally, we can write a "formula" for converting x feet into inches. Here, x is an undefined number called a variable. Our formula would be 12x. Furthermore, we might give this formula its own symbolic name--for instance, f. So,
![]()
Note that as the variable x varies, so does f. Because the value of f depends on the value of x, we call f in this case the dependent variable. Concomitantly, we call x the independent variable, since our choice of x is (essentially) arbitrary. Since the dependent variable depends (as the name indicates) on the independent variable, we can list x in parentheses next to f, indicating that f depends on x:
![]()
What we've done here is give some mathematical rigor to the intuitive process of converting feet into inches. Now, to convert any number of feet into inches, we just plug the number of feet into our formula in place of the independent variable. For instance, try 10 feet:
![]()
The formula tells us that 10 feet is equivalent to 120 inches. This type of "formula" is generally called an algebraic relation. If, however, for every possible value of the independent variable, the relation has only one corresponding value for the dependent variable, then the relation is called a function. Note that in our example above, f(x) is a function because regardless of the value we choose for x, f can only be one value (12 times x). An example of an algebraic relation that is not a function is g(x), given below.
![]()
For a given value of x, g can be either a positive or negative value; hence, g is not a function.
We will deal only with functions whose dependent and independent variables take values in the set of real numbers only. That is, we only deal with real variables and real-valued functions.
Practice Problem: Define a function that expresses the area of a square in terms of the length of one of its sides.
Solution: Our first task is to identify the dependent and independent variables. In this case, the area of the square is the dependent variable because we want to express it in terms of the length of one side--which is thus the independent variable. When naming variables, you can choose any symbol you want, but it's often convenient to use something that relates to the problem at hand. Let's choose A for the dependent variable (area) and s for the dependent variable (length of a side). Note that case is important for functions: A and a are generally two different variables (unless they are explicitly defined as being equal).
Now, we know from basic geometry that the area of a square is the length of one side raised to the second power. So, let's write the function. In parentheses next to the dependent variable, we'll list the independent variable.
![]()
Graphing a Function
We'll often find it convenient to draw a "picture" of a function to represent how the dependent variable changes with the independent variable. We can represent real numbers using the real line: each number in the set (coordinate) has a corresponding point on the line. Let's use the real line to represent the possible values of the independent variable x for a function f(x).
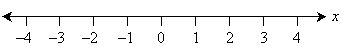

(Remember that although the line above only shows integer values, the line actually includes all real numbers in between the integers as well--we simply label the integers for convenience.) Now, we can overlay another real line perpendicular to the one above; this line corresponds to the value of f(x).

The point at which the two real lines cross is called the origin, and each line constitutes an axis. Note that if we draw parallel lines through each point on the axes, we get a grid, where each point on the grid has a corresponding x coordinate and f(x) coordinate.

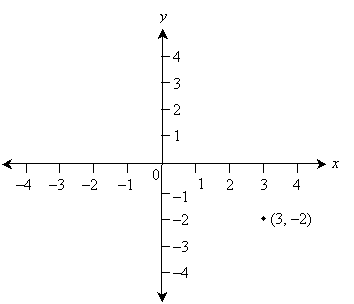
Points on a graph are generally represented in the form (x, y), where x is the coordinate along the horizontal axis and y is the coordinate along the vertical axis. The point (3, –2) is shown below to illustrate.

Now, if for every value of the independent variable x we find a corresponding value for f(x), we can plot the function using this type of graph. Obviously, we can't find every point on the graph, so instead, we can simply find some representative points and then connect them. (What constitutes representative and how best to connect the points depends on the function--the more points you find, the more accurate your graph will be, generally.) Let's consider the function f(x) = 2x as an example. For each integer, let's plot a corresponding point and then connect these points; we'll do so over the x interval [–2, 2].
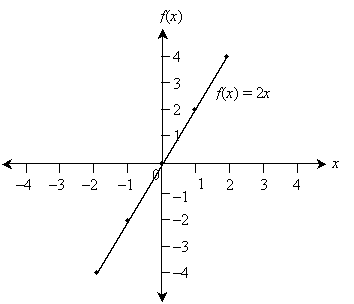

Note that the graph above only shows the function over the x interval [–2, 2]; the function in this case is defined over the entire real number line, however. The plot includes several points on the graph of f(x), but these are unnecessary.
Practice Problem:
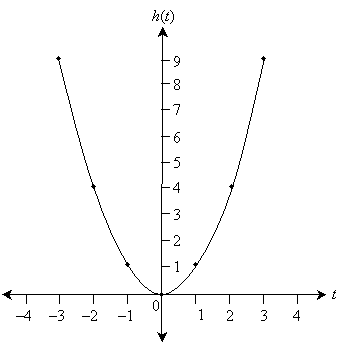
Plot a graph of the function h(t) = t2 over the t interval [–3, 3].
Solution:
First, find some representative points on the graph-say, for the integers between –3 and 3. These include the points (–3, 9), (–2, 4), and so on. Now, draw an appropriate set of coordinate axes. Since the function h(t) has only positive values, we'll omit negative values on the vertical axis. Plot the points and then connect them smoothly--if you need more detail, try finding the coordinates of more points.