Introduction
In this article, we will provide you with an overview of PowerPoint's text tools and capabilities. Additionally, we will cover the use of lists, multi-level lists and Word Art.
Learning Outcomes
Add text boxes and insert text
Format text
Use proofing tools
Using Text Boxes
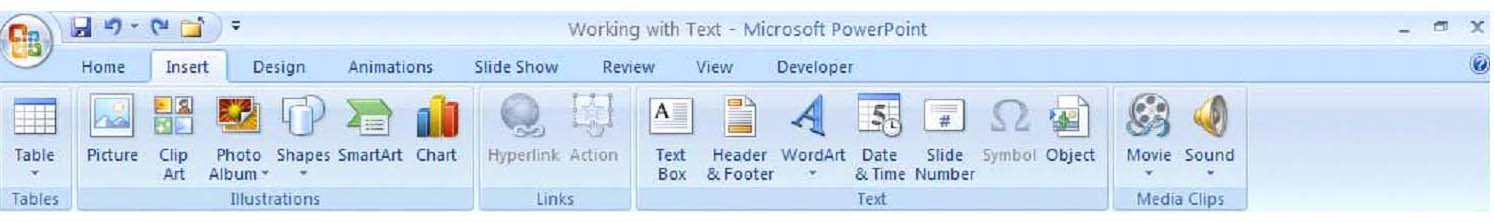
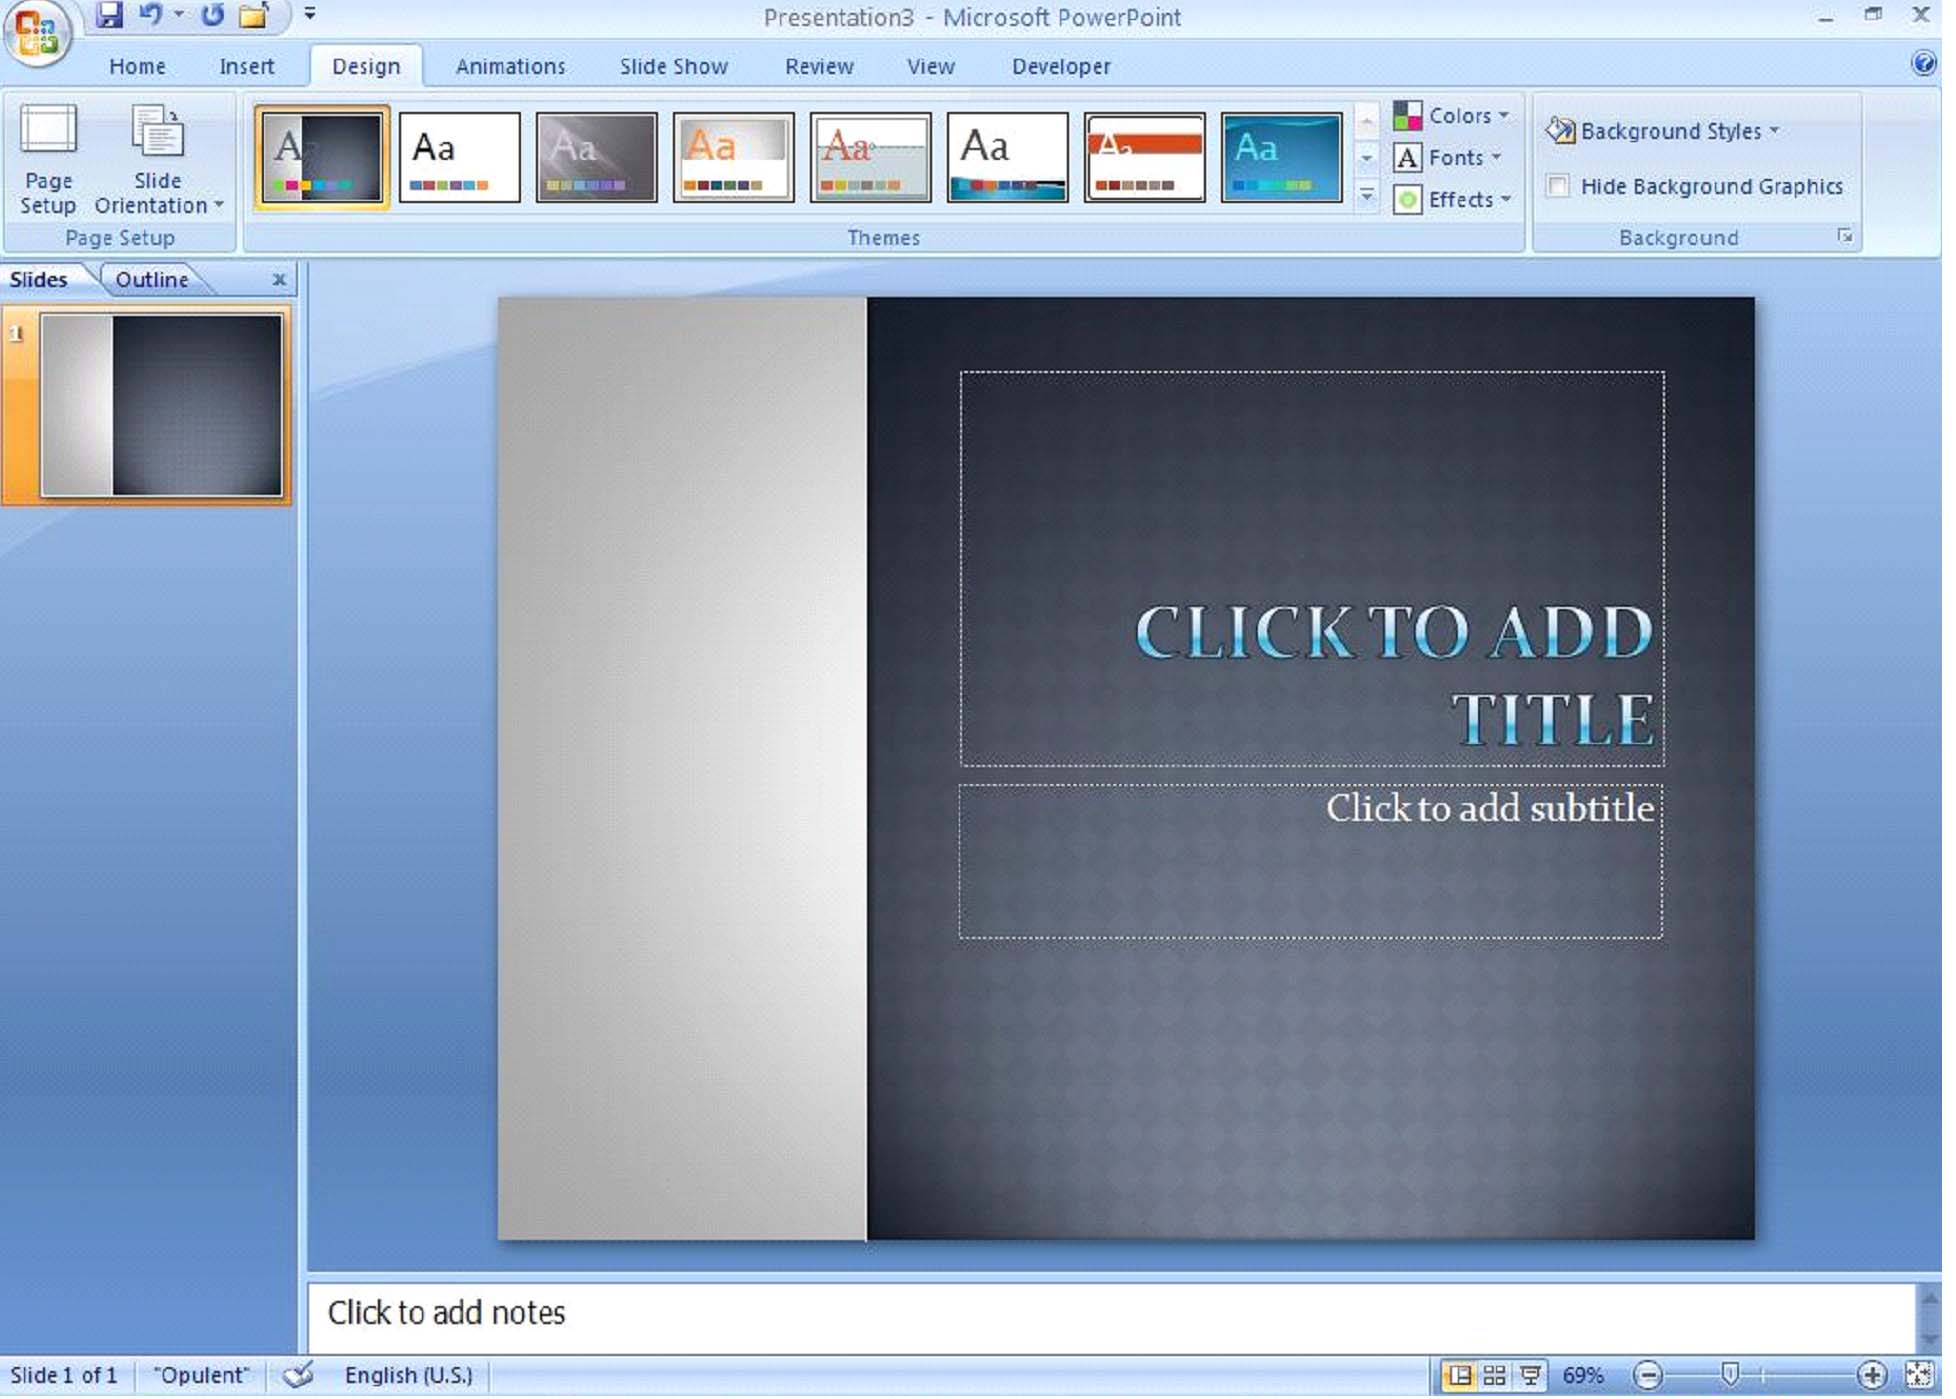
In PowerPoint presentations, all text is presented inside a text box, regardless of whether or not the text box itself is visible. We will start by opening a blank presentation and call it Working with Text . On the Insert tab, click on Text Box (see Figure 4.1).
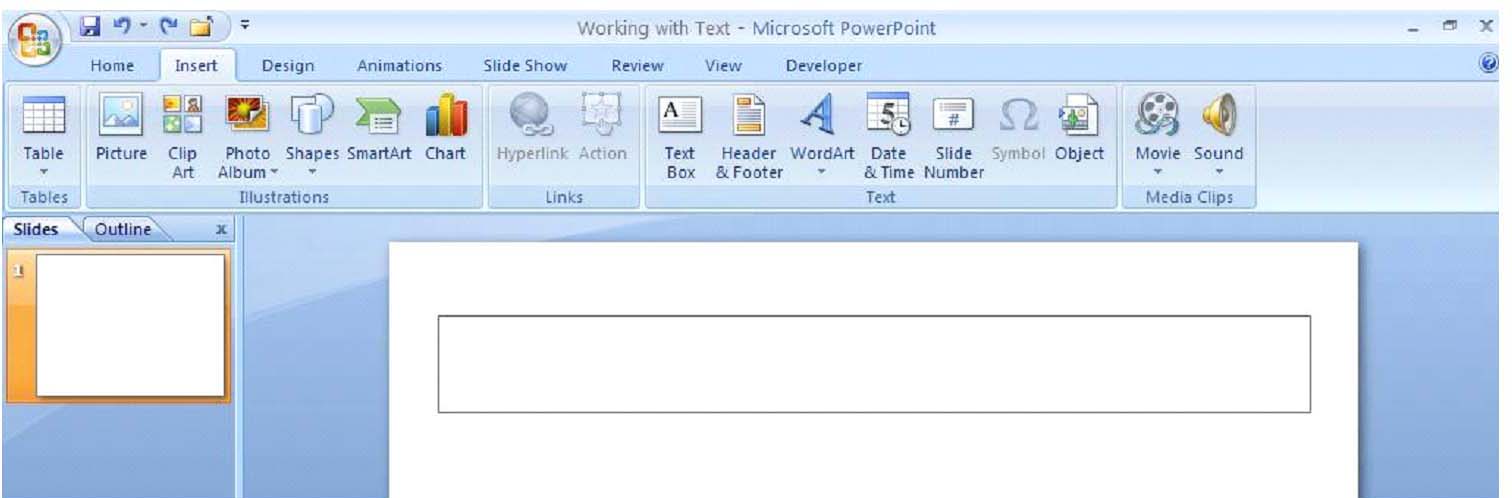
Inside the presentation, click and drag to draw the text box as you would like it to appear (see Figure 4.2).
To insert text into your text box, click inside the text box and either type or paste text (see Figure 4.3).
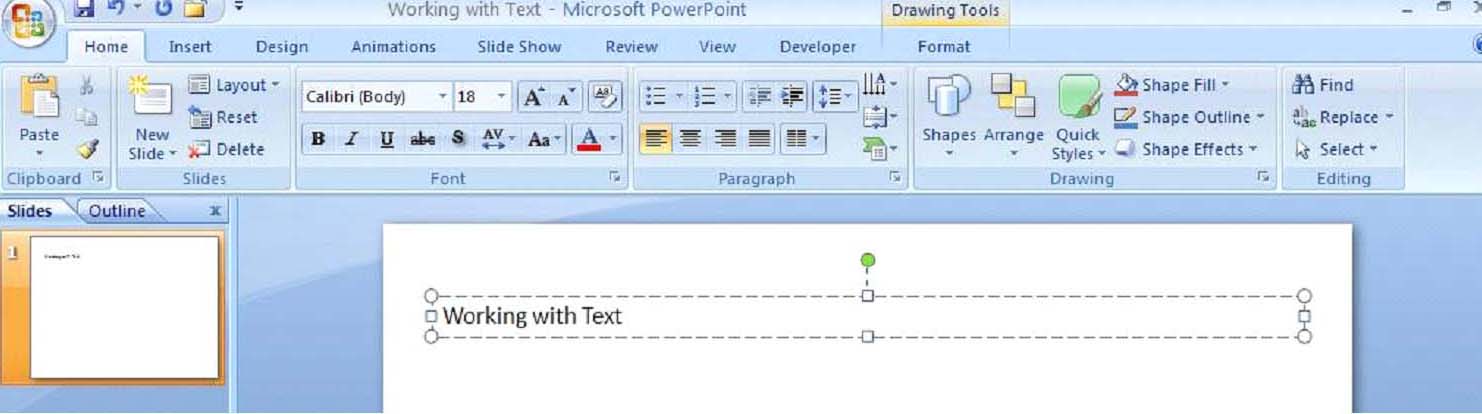
Figure 4.3 � Adding Text to a Text Box
Formatting Text
To format the text in the text box, you may either use the formatting options on the Home tab in the Font group, or you may select the text you wish to format and use the semi-transparent mini-toolbar that appears. For the purposes of this section, we will use the commands on the Ribbon.
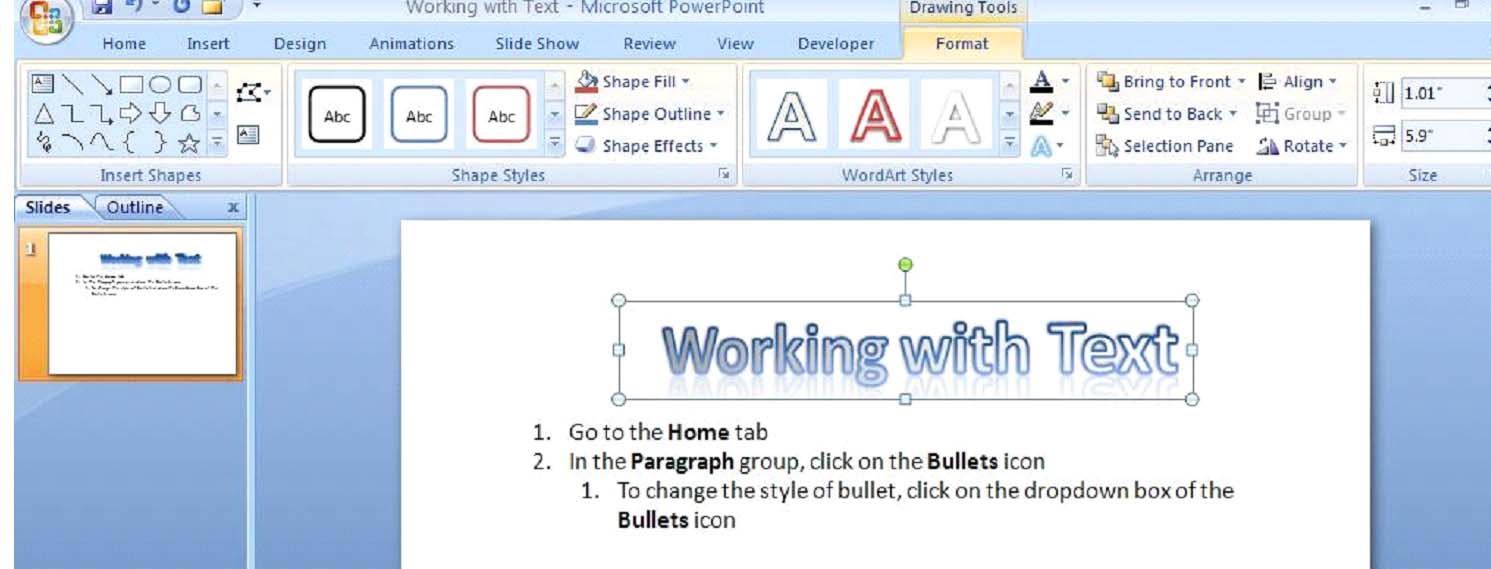
After selecting the text in the text box, you may change the font size, color, alignment and font type in any way you choose. In Figure 4.4, we have centered and bolded the text, changed the font type to Dolphin Extended, enlarged the font size to 40, added a shadow and changed the font color to aqua.
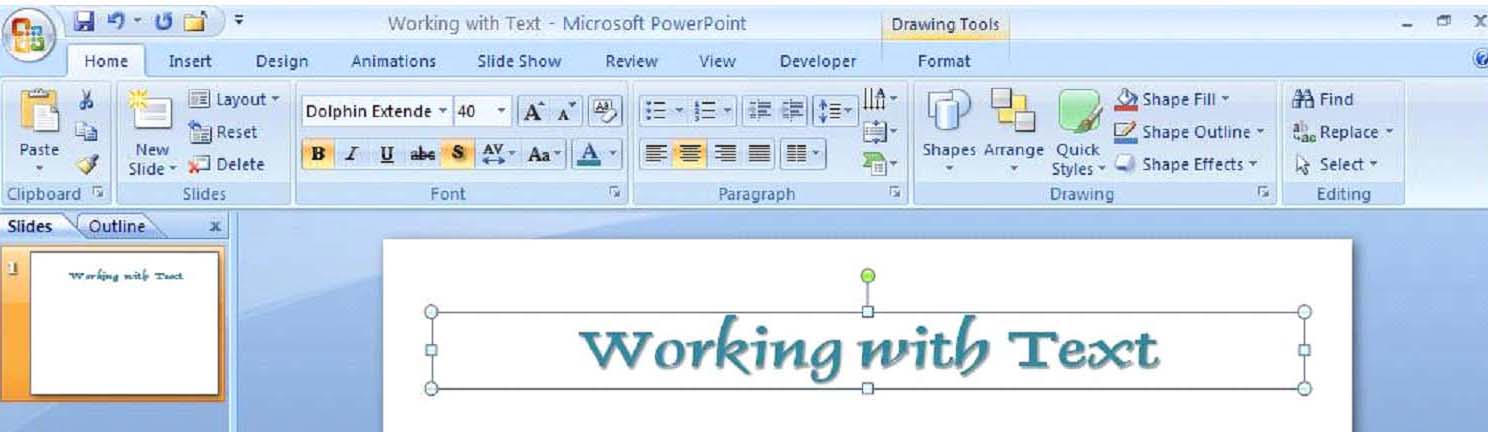 Figure 4.4 � Formatting Text in a Text Box
Using Text Proofing Tools
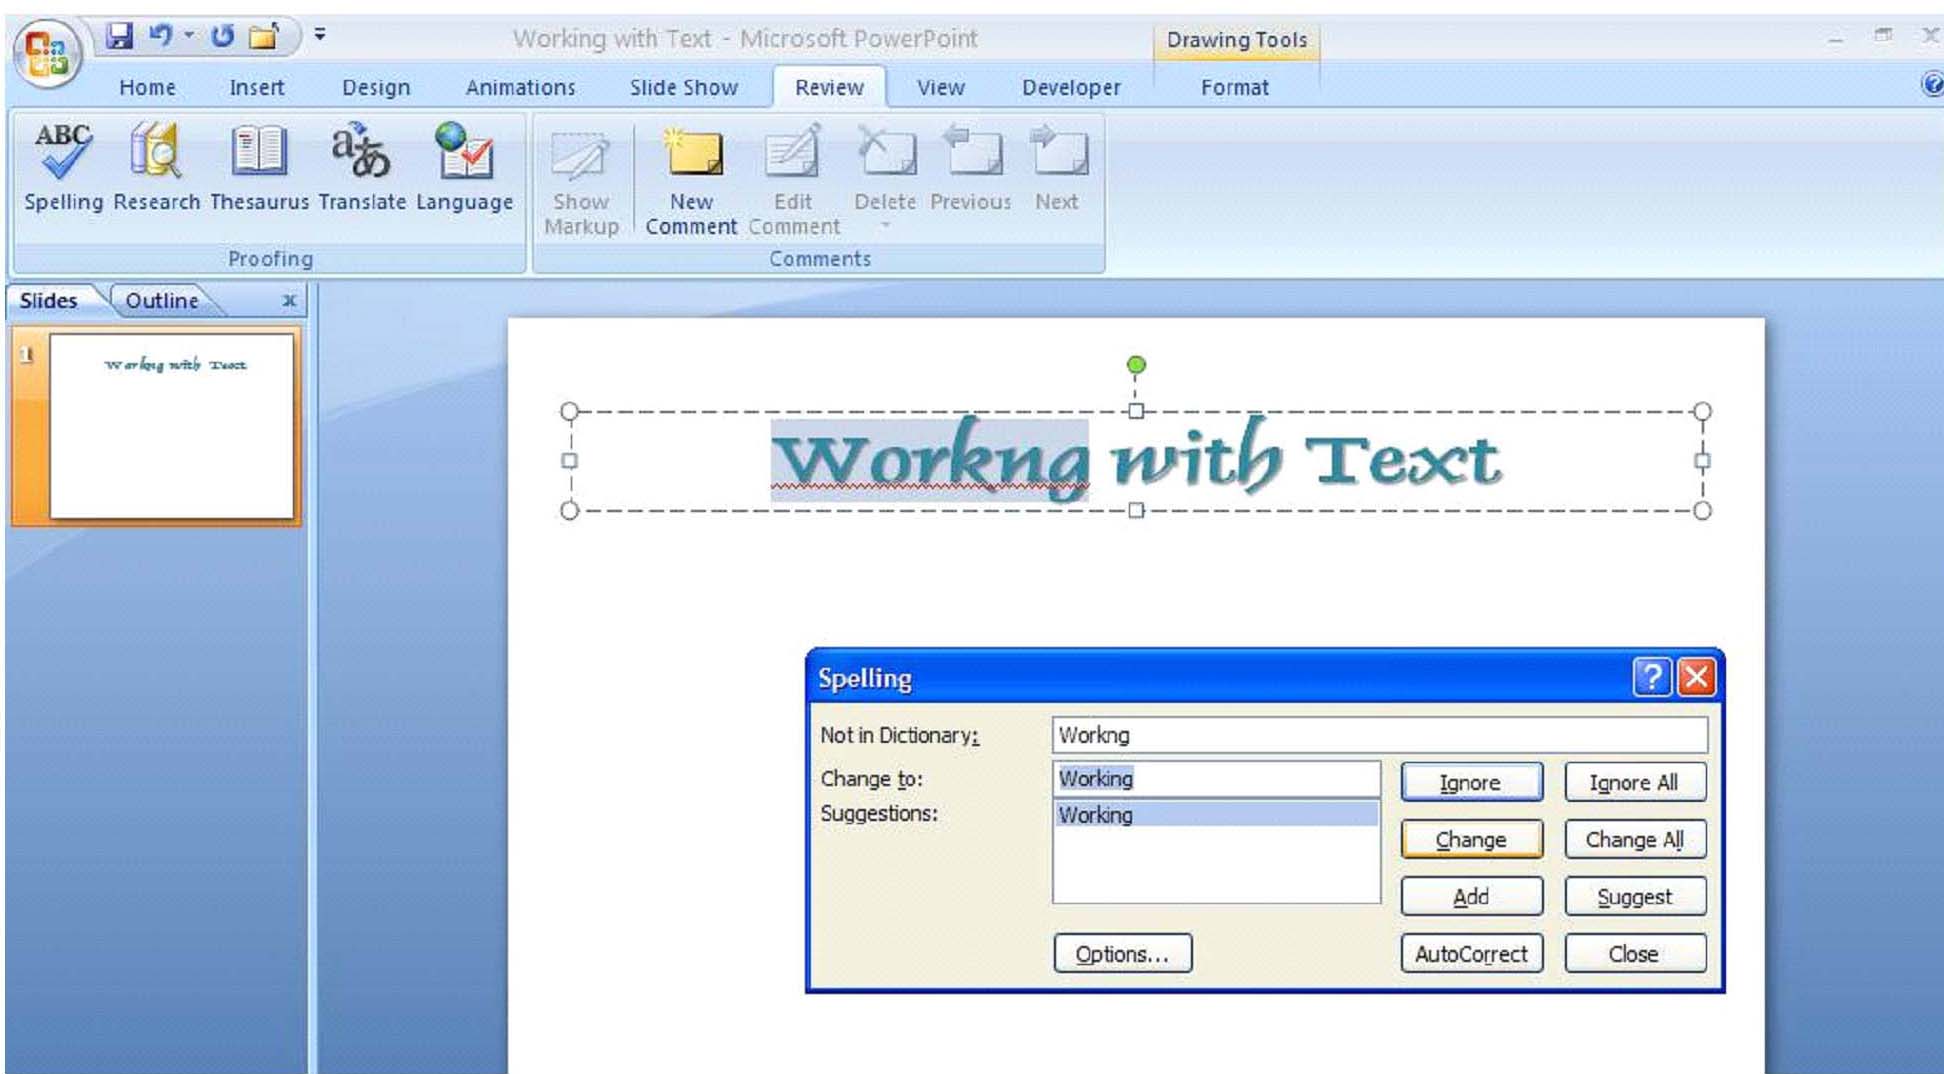
The main text proofing tool offered in PowerPoint 2007 is Spelling. This command is available on the Review tab in the Proofing group. Figure 4.5 shows the spelling dialog box making a suggestion for a misspelled word as well as different options such as Ignore, Change, Ignore All, and Change All. As you can see, PowerPoint underlines any misspelled word in red.
Lists and Multi-Level Lists
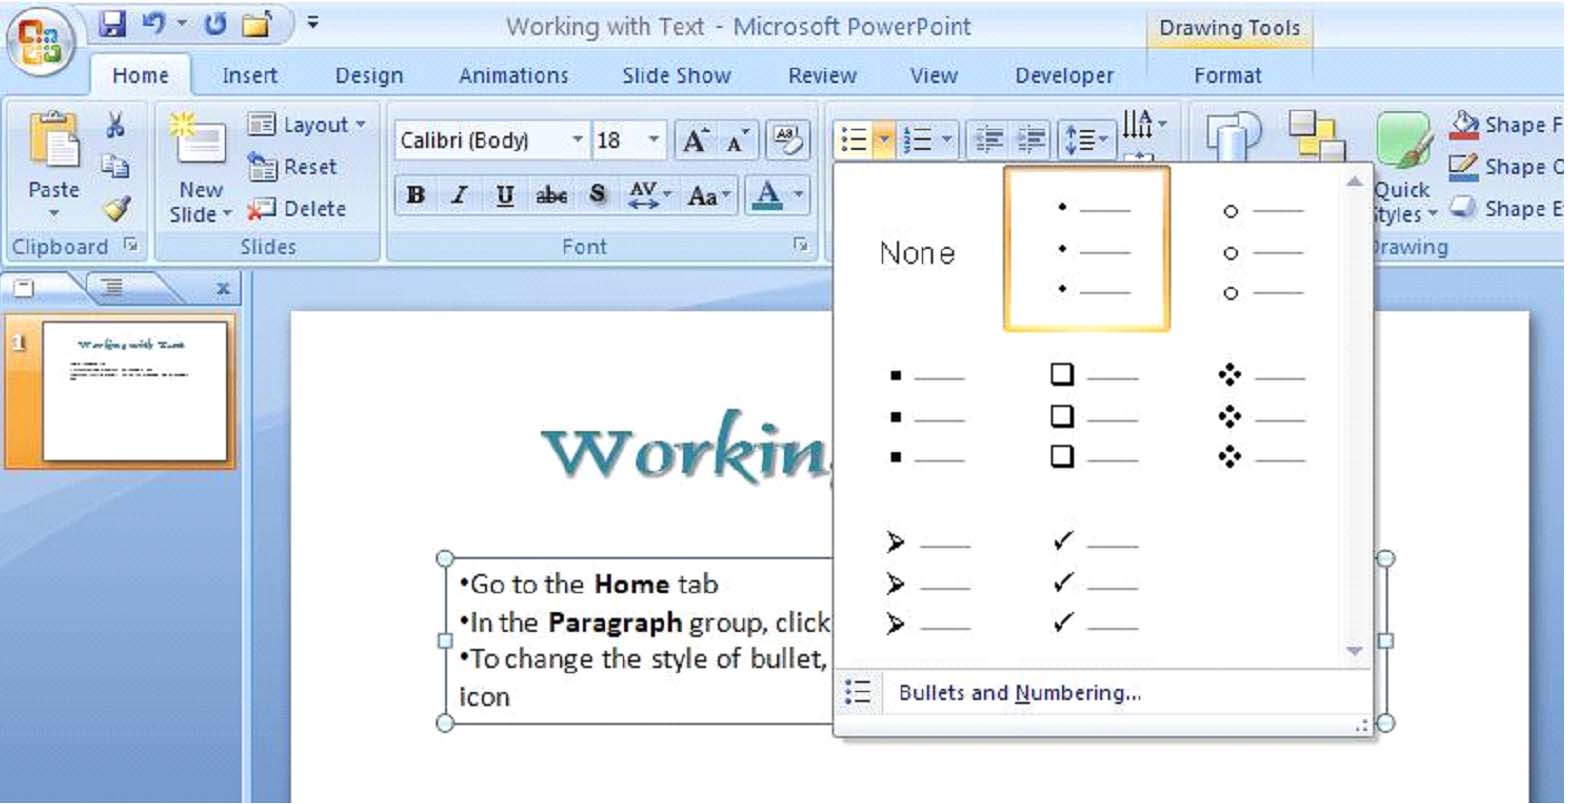
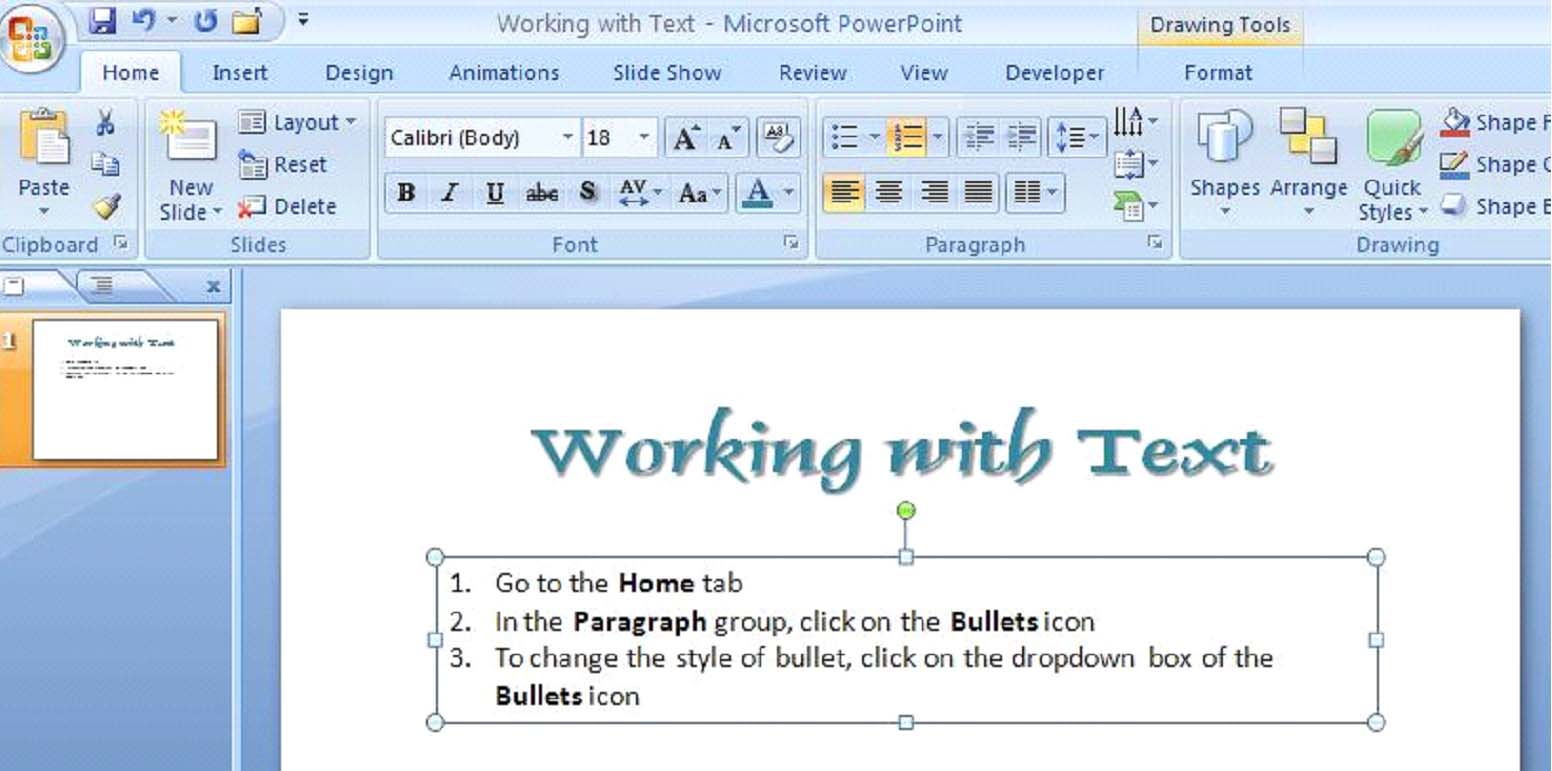
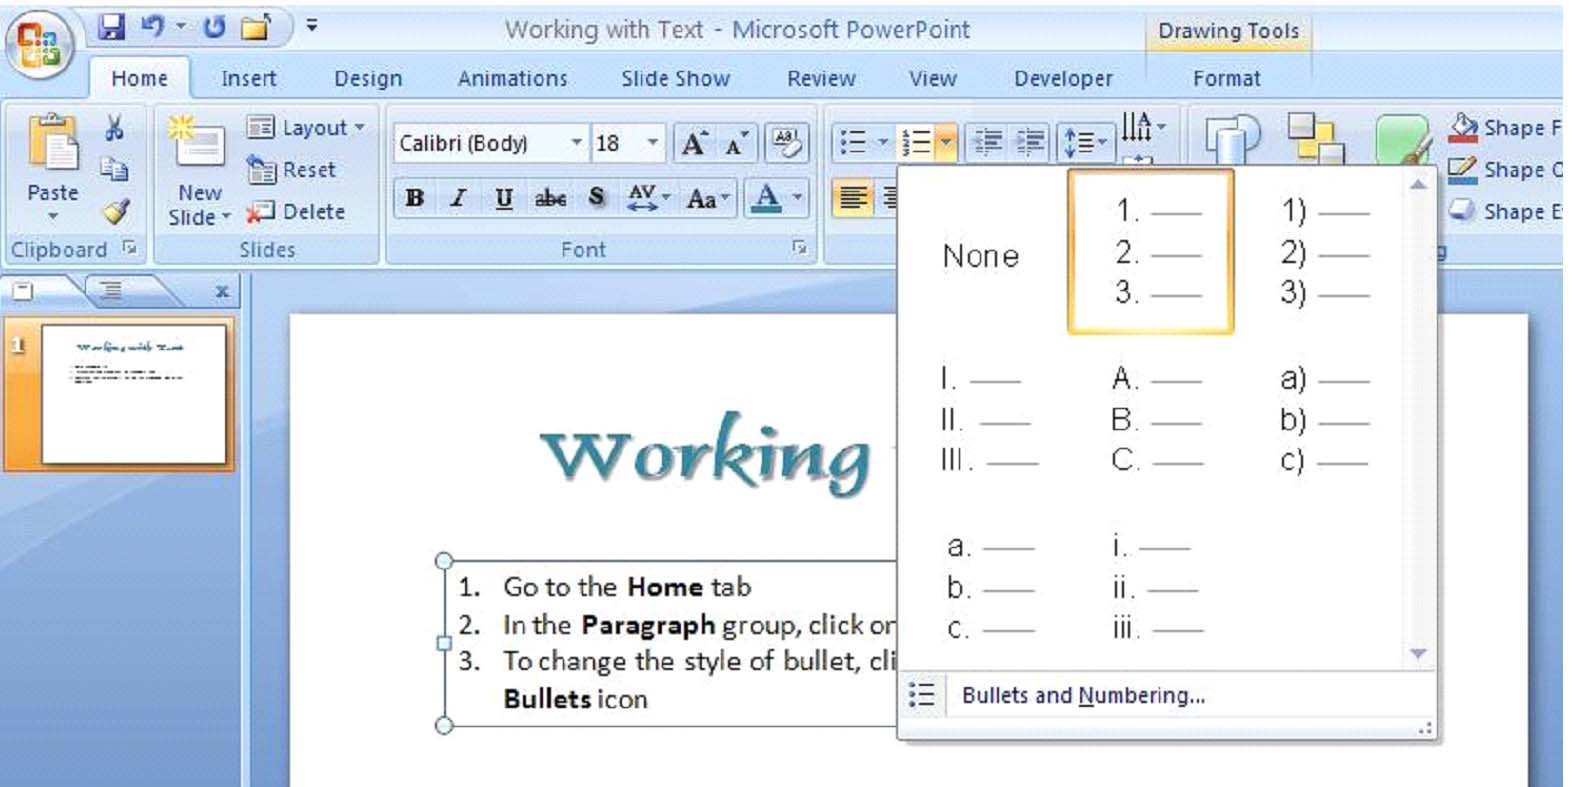
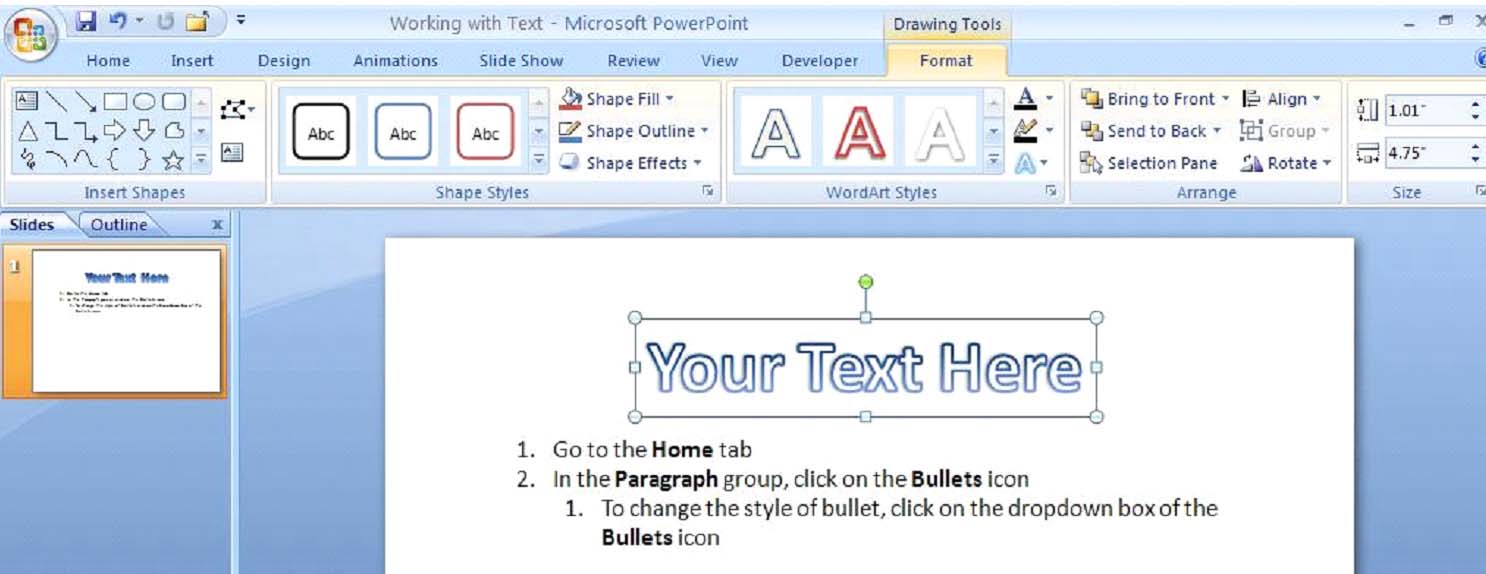
Numbered lists are also frequently utilized in PowerPoint presentations. In order to create a numbered list, insert a text box and on the Home tab, click on the Numbering icon in the Paragraph group (see Figure 4.9). To change the style of your numbered list, click on the dropdown arrow of the Numbering icon, which will provide you with further options.
 or Increase List Level
  commands on the Home tab in the Paragraph group.
-
Numbered list icon
Using Word Art
Word Art is a feature that is included in earlier versions of PowerPoint, but the most current version has by far the most pre-installed and editing options. Among other things, Word Art allows shadowing, rotating, outlining and coloring text. Additionally, since PowerPoint treats Word Art as an object, all of the new features applicable to objects and pictures are also available for Word Art.
Word Art Tip: Although Word Art is impressive and certainly fun to use, it is important not to overuse it because too much of a good thing can seem jumbled and disorderly.
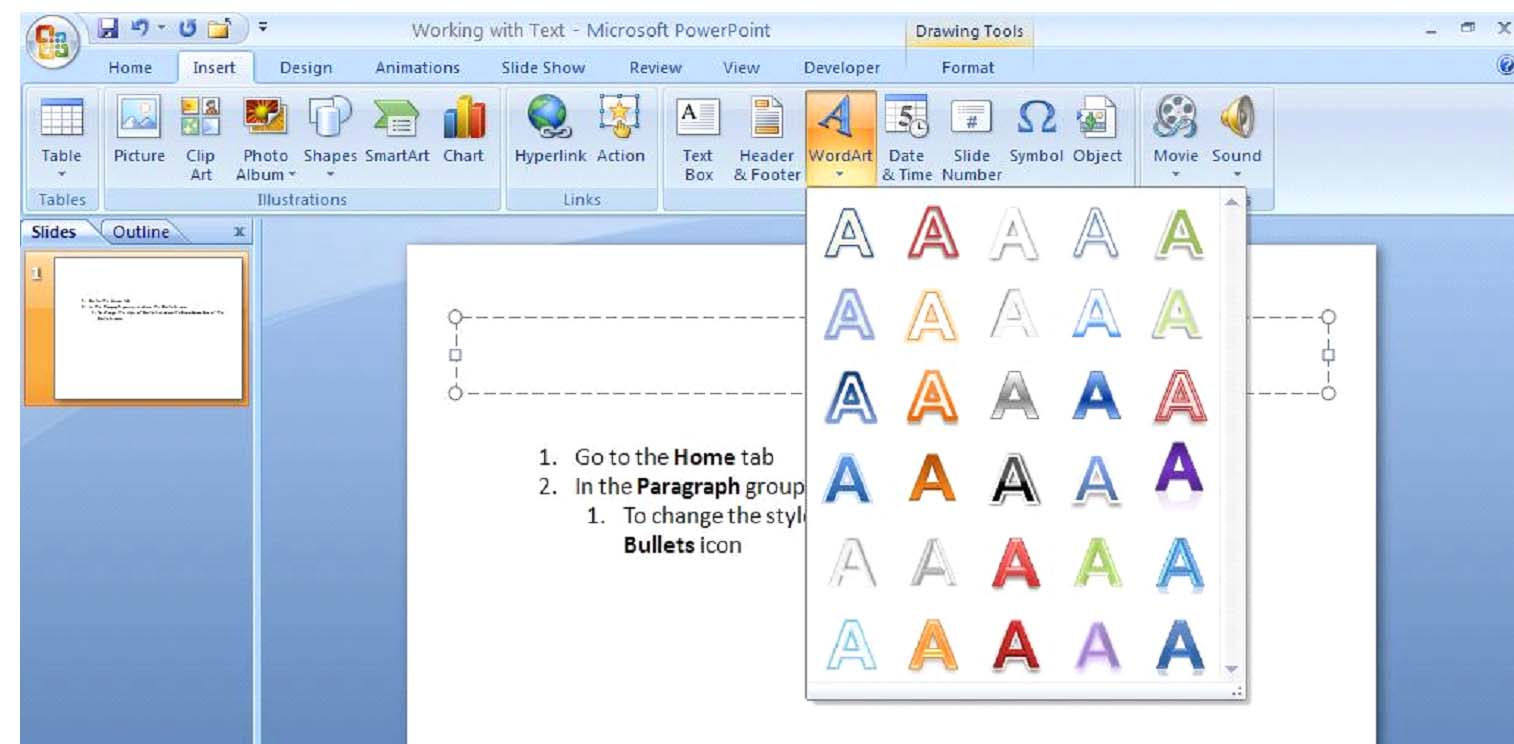
For the sake of this section, let's say we want to change our title "Working with Text" into Word Art. First, on the Insert tab, select Word Art in the Text group. A group of pre-installed Word Art options will appear (see Figure 4.11).
Choose your preferred style and a text box will appear on your screen, ready for you to insert your text. Additionally, the Ribbon will automatically change to the Format tab for Drawing Tools (remember, Word Art is seen as an object by PowerPoint).
- Text Effects feature
- Theme Colors feature
Themes and Customized Themes
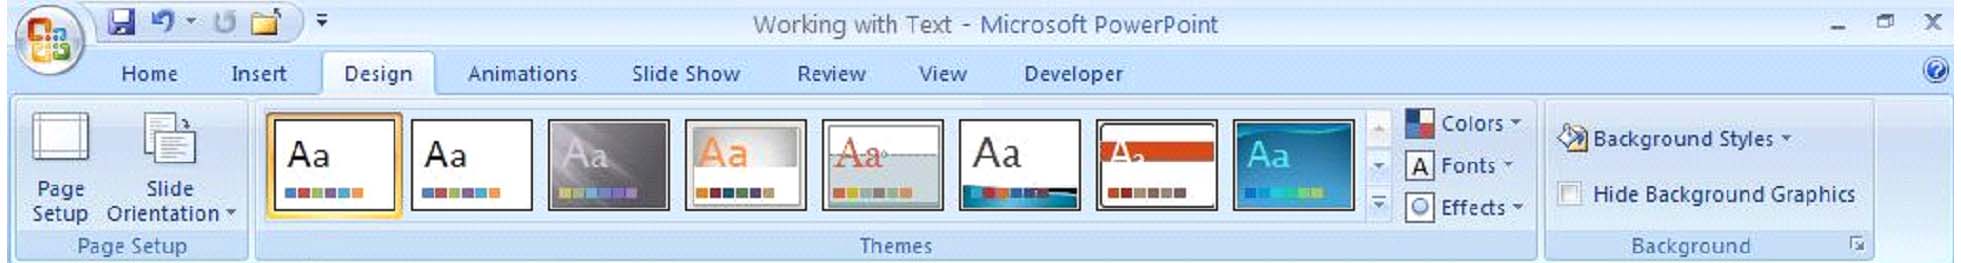
Themes are pre-installed files that contain the three complementary features of colors, fonts and graphic effects. Usually, a single theme will contain two fonts (one for the headings and one for the text), twelve coordinated colors, and specific graphic effects that will apply to charts, graphs, tables, diagrams, shapes and pictures.
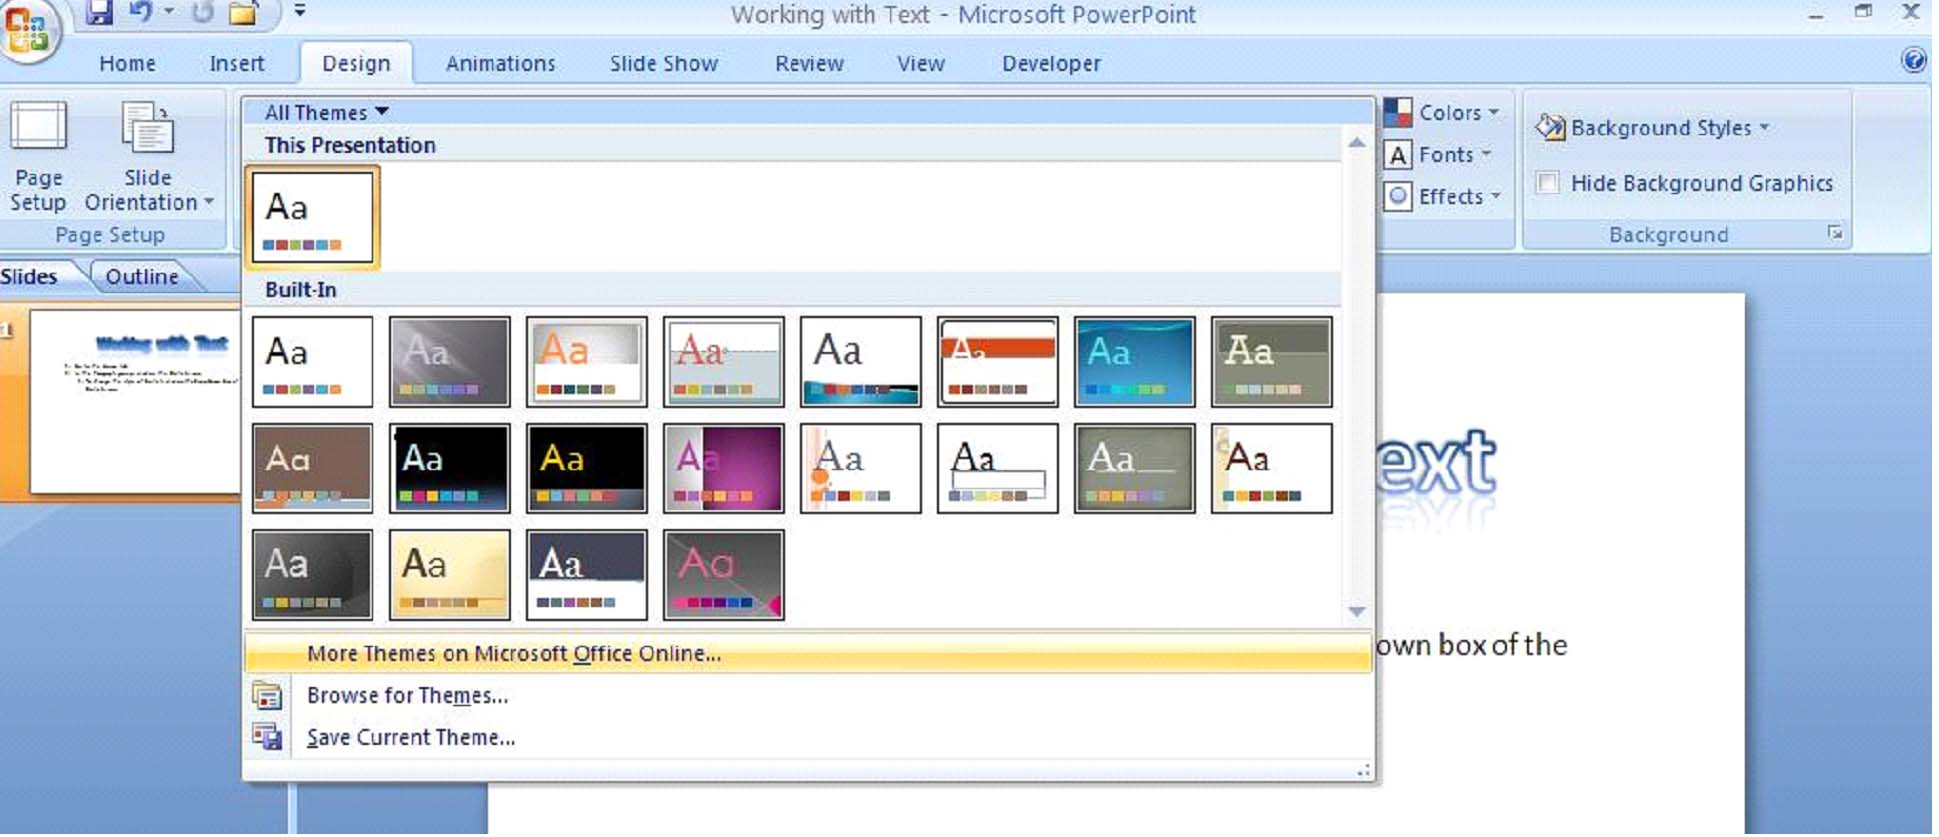
Clicking on the Themes dropdown arrow will show twenty pre-installed themes available for use with PowerPoint 2007 as well as the option for browsing for themes in Microsoft Online (see Figure 5.2). PowerPoint 2007 will automatically connect you to Microsoft Online without the need for you to connect to the internet separately.
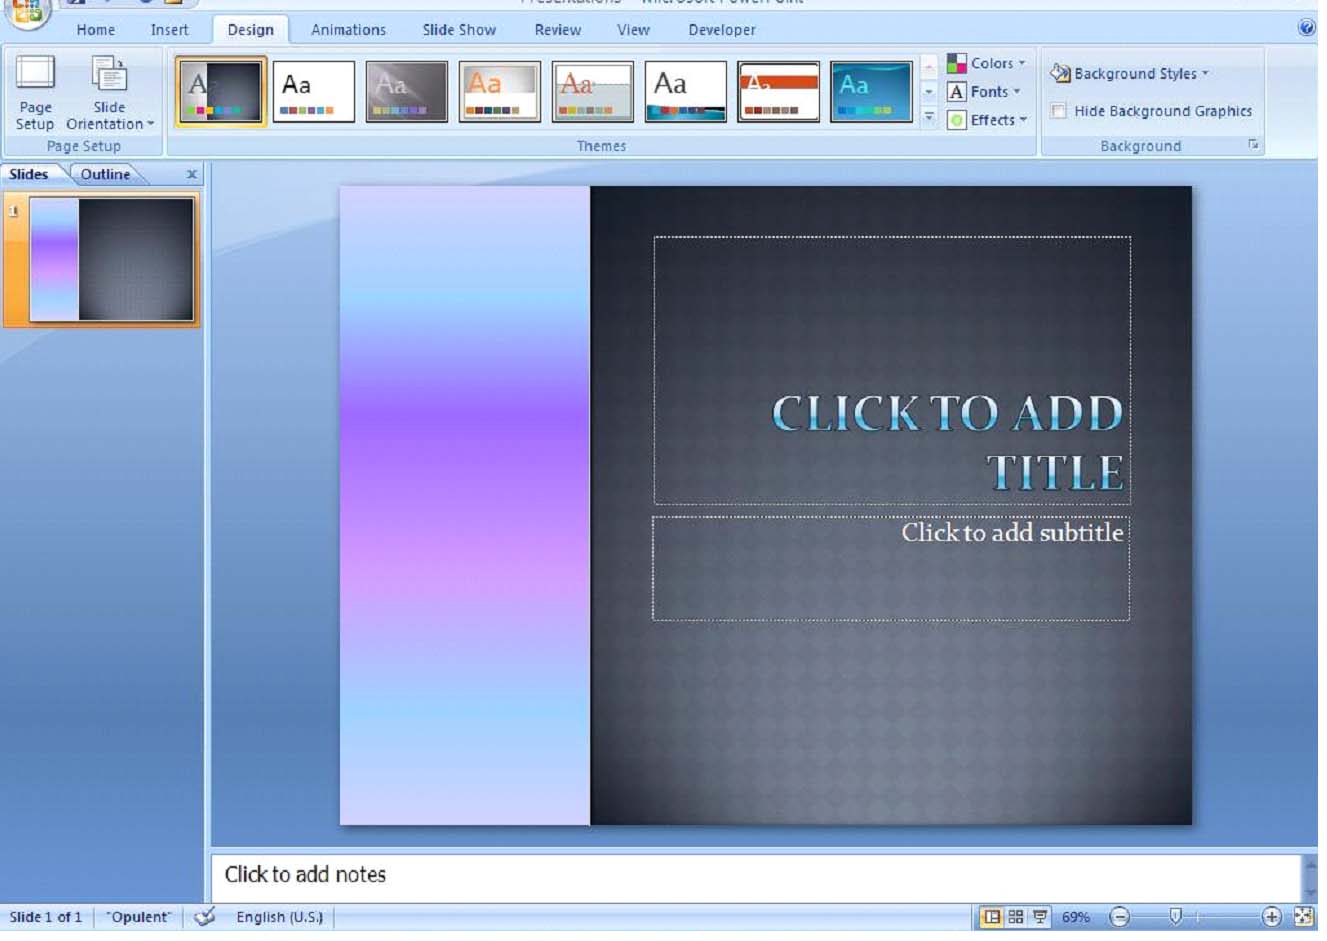
Using Backgrounds
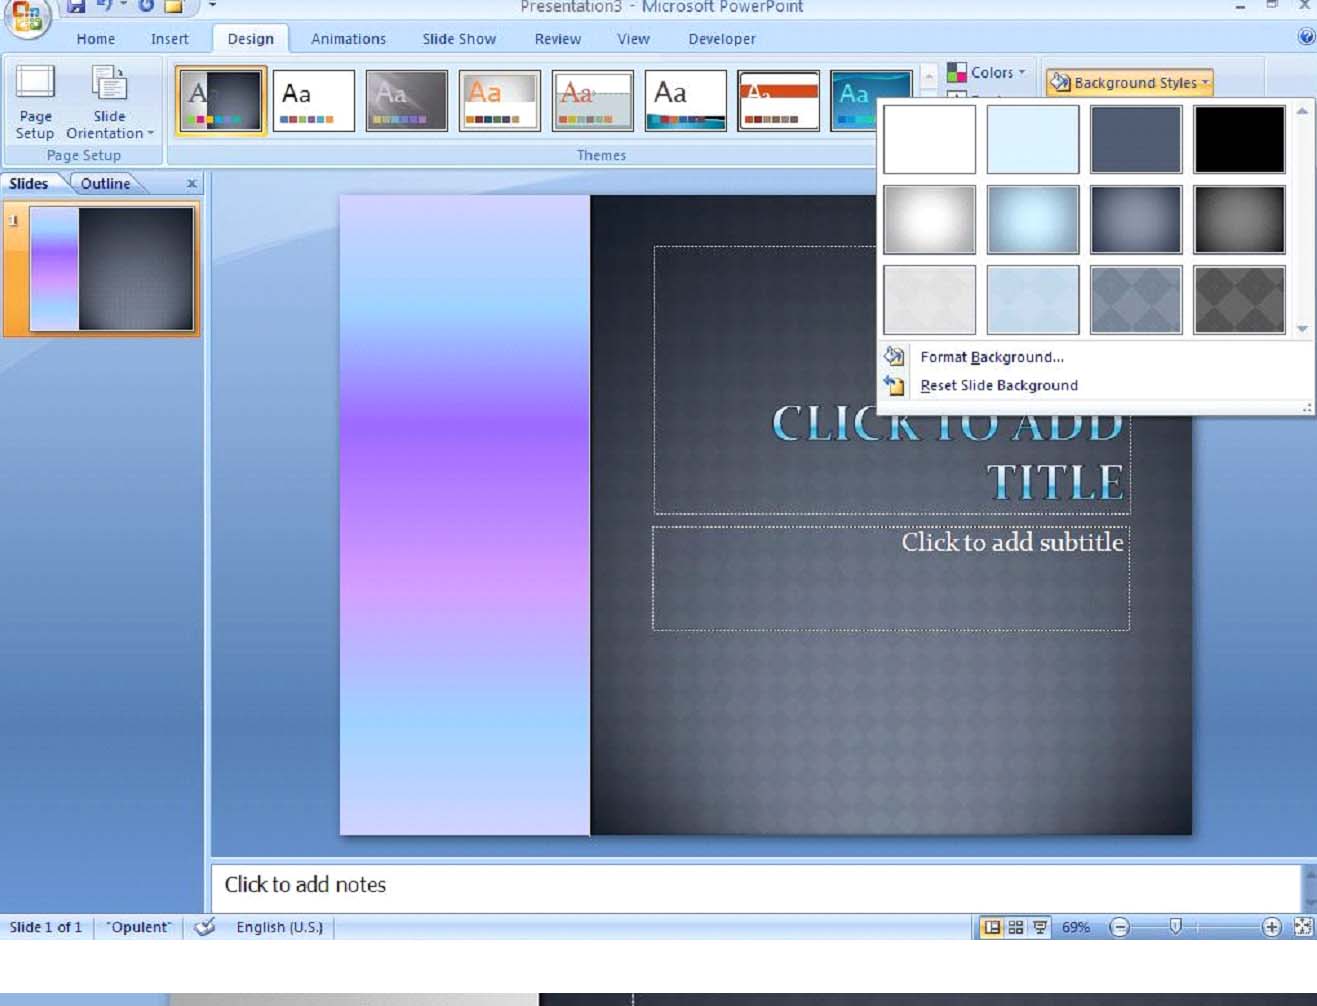
In Figure 5.5, we took the sample customized theme from Figure 5.3 and applied the pre-installed "Calm Water" gradient in a "Linear Down" direction.
Working with Charts, Graphs, & Tables
Introduction
This article will provide an overview of how to effectively work with charts, graphs and tables to make the most out of your PowerPoint 2007 presentation.
Learning Outcomes
Adding and Formatting Tables
Tables are a valuable, convenient way to convey a lot of information attractively in a small amount of space. To include a table in your PowerPoint presentation, simply use the Insert Table command in the Tables group of the Insert tab. Clicking on this command allows you to specify the number of rows and columns you would like your table to have. As you select the size of your table, it automatically appears on the current slide in the default colors and style.
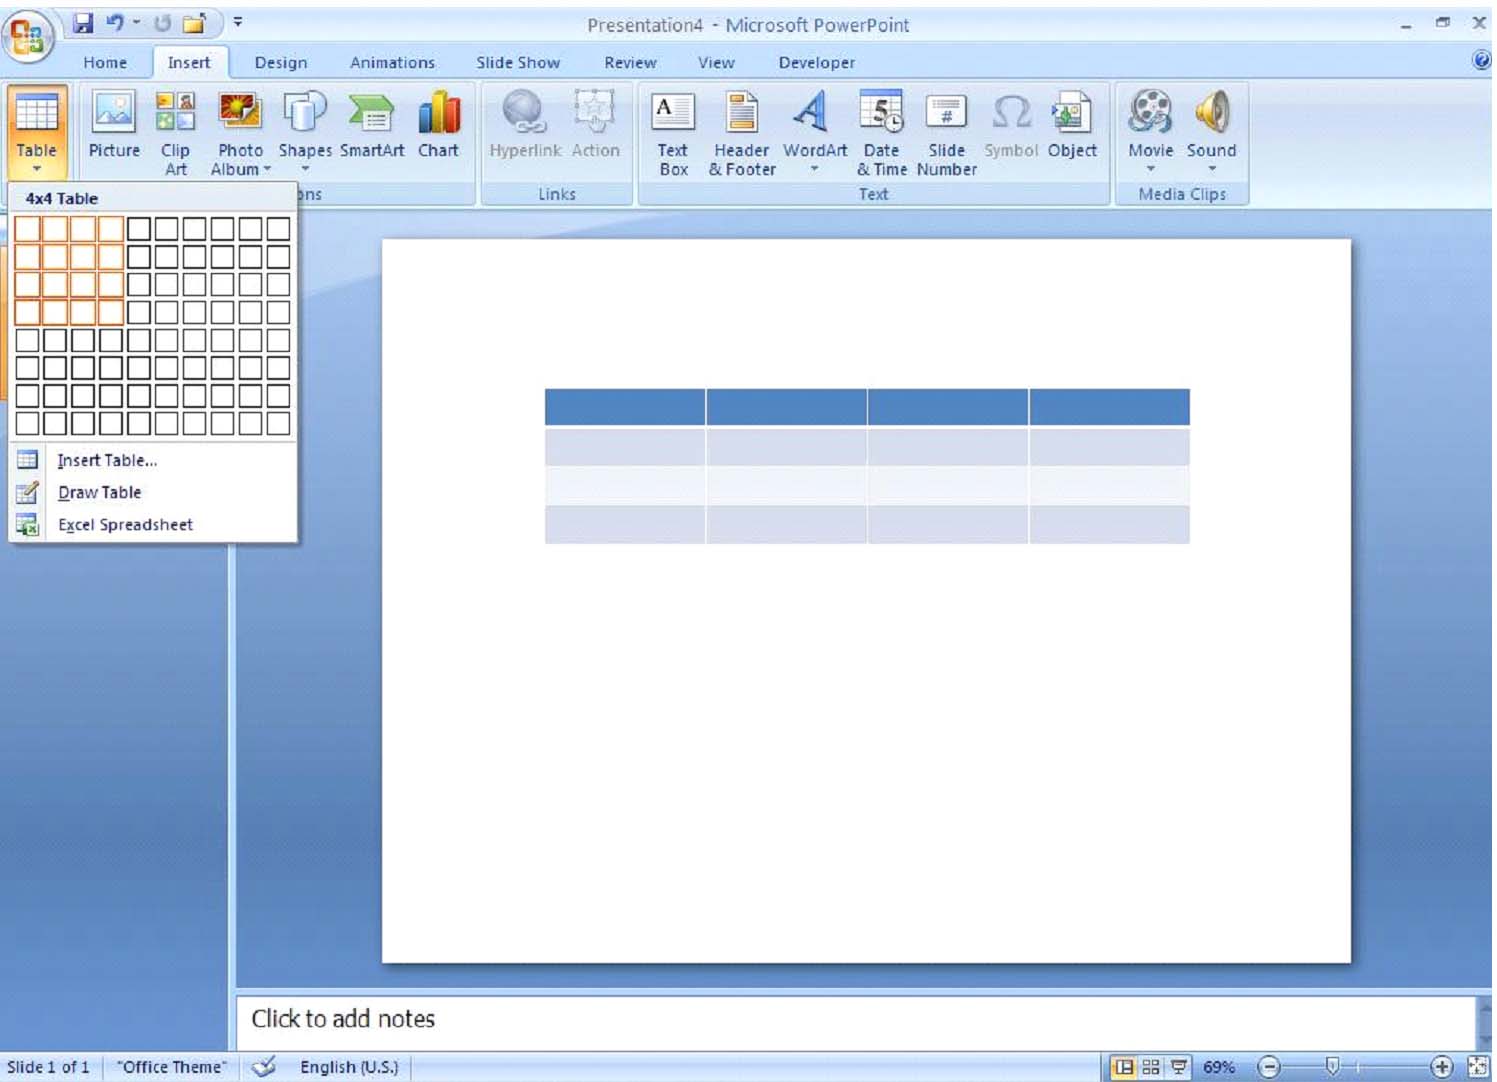
Figure 6.1 � Inserting a Table
As you can see in Figure 6.2, once you have created a table, the Design tab forTable Tools appears on the Ribbon. You may enter text as we have done here and then begin to format your table. In this case, we have chosen Table Style"Medium 3 � Accent 5" and centered the text in the three right columns. We have also added a "Soft Round" bevel to the cells as well as an offset right diagonal shadow to provide a more finished look.
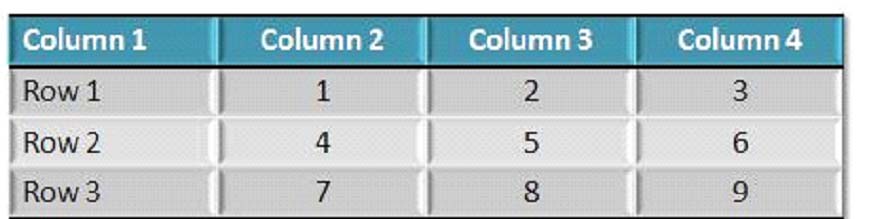
Figure 6.2 � Customized Chart
The Table Effects feature enables you to add different bevels, shadows andreflections.
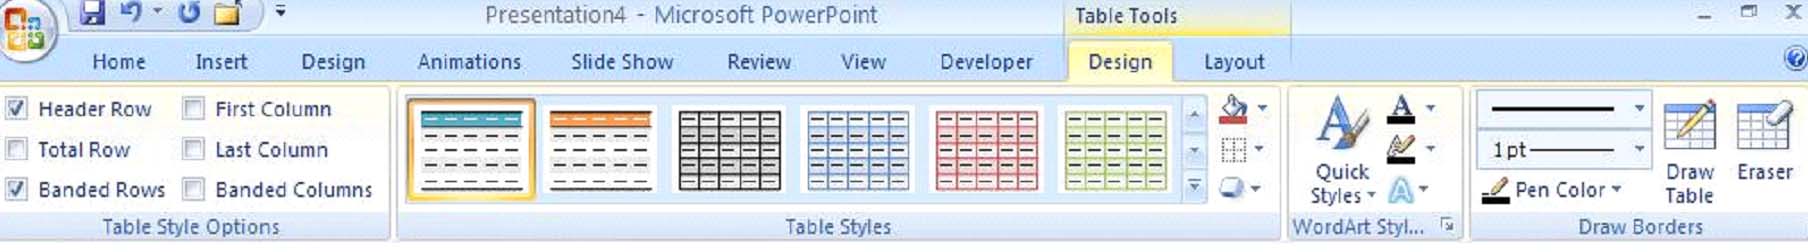
Figure 6.3 � Table Effects Feature
Inserting Tables from Other Office 2007 Applications
Microsoft Office Excel is the main source of imported tables in PowerPoint 2007 because along with the data in the table, Excel also offers the added feature of importing formulas and calculations.
The best way to go about inserting an Excel table is to start a new slide with theTitle Only layout. In the Tables group of the Insert slide, select Excel Spreadsheet.
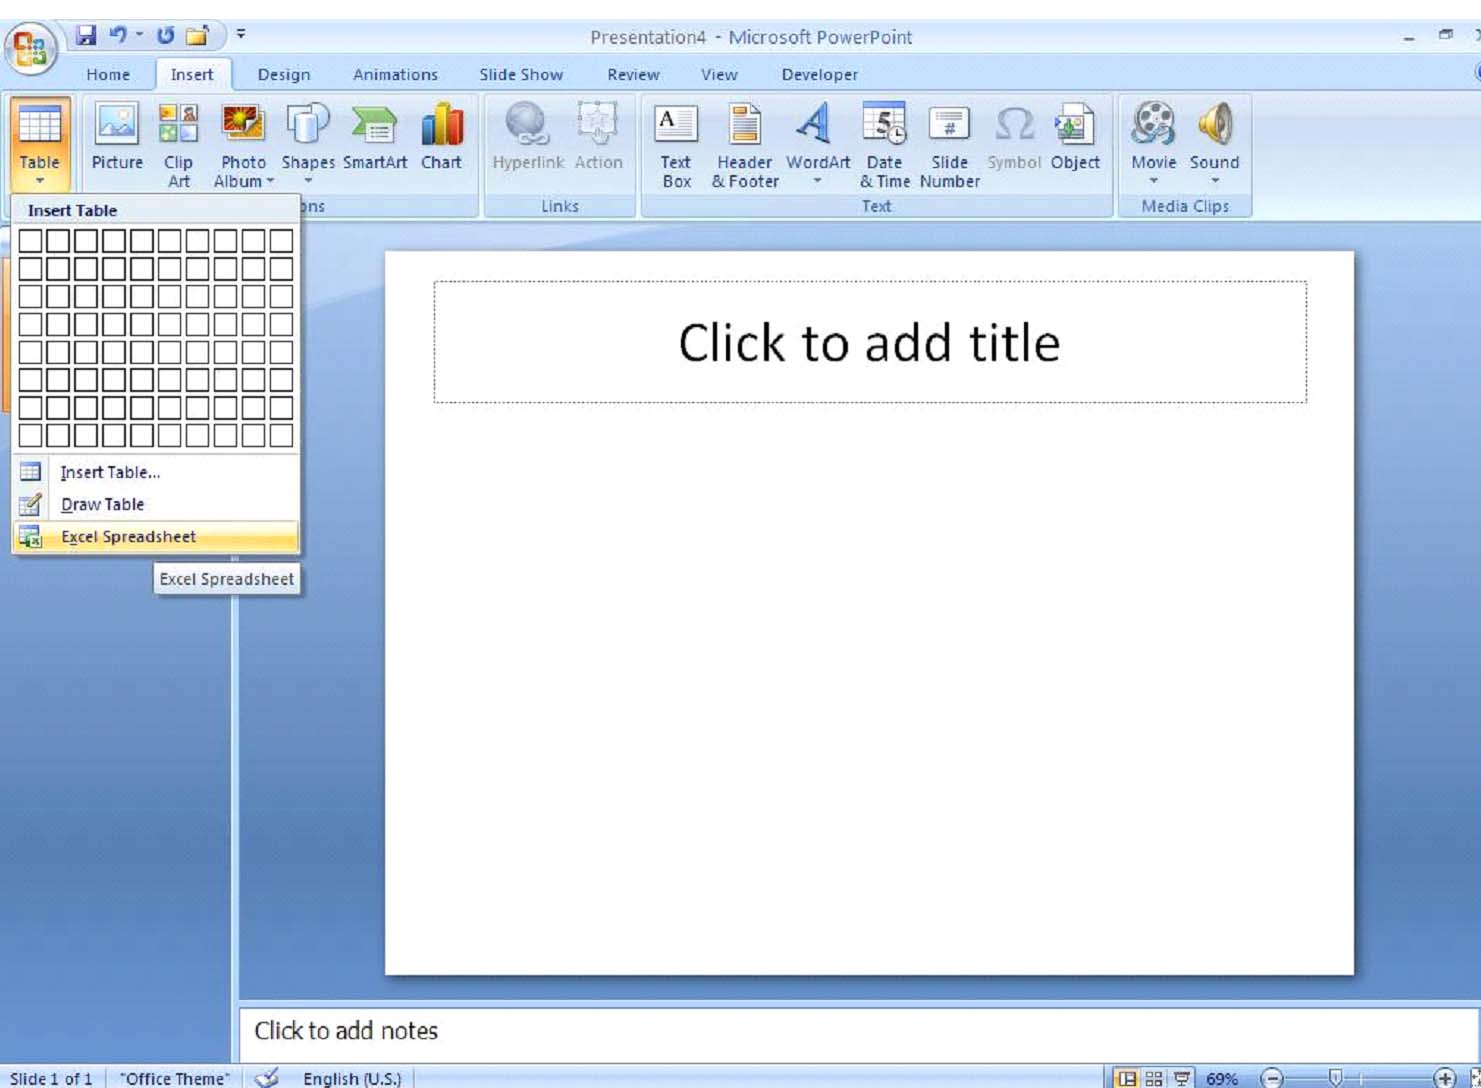
Figure 6.4 � Inserting an Excel Spreadsheet
An excel spreadsheet will appear on your slide and you may adjust the size and location to best suit the slide. You may enter data and add formulas as though you are working in Excel (because you actually are) and when you have finished, you may format the spreadsheet or simply click anywhere else on the slide to return to the normal PowerPoint interface.
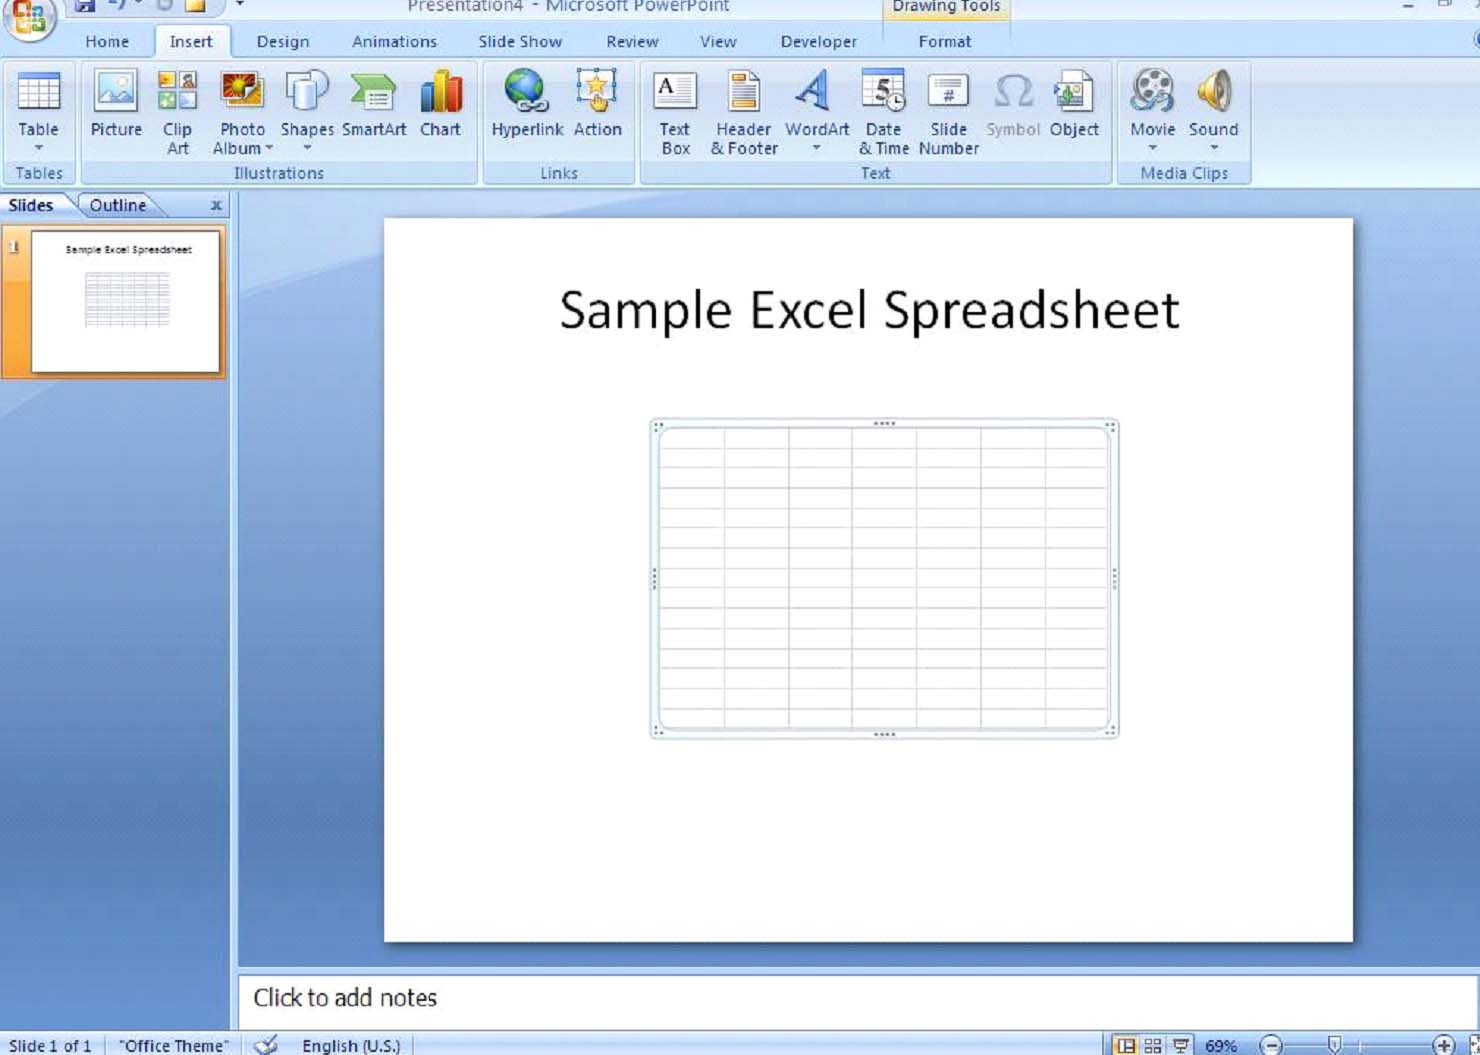
Figure 6.5 � Sample Excel Spreadsheet
Excel Table Tip: Although any slide layout may be used when inserting Microsoft Excel tables into PowerPoint 2007, the Title Only layout requires the least amount of re-formatting after insertion.
Working with Different Types of Charts
When it comes to charts in PowerPoint 2007, the most important change is that all data is now handled by Microsoft Office Excel. Every time you insert a chart, Excel automatically opens so that you can create much more detailed charts without having to store or edit the data separately.
Chart Tip: It is important to note that although the terms chart and graph have different implications, for the purposes of PowerPoint 2007 and Excel, the two terms are interchangeable.
Before creating a chart, it is important to cover some of the basic terminology associated with them.
1. Axis � usually referred to as X (horizontal or Category) and Y(vertical or Value), an axis is a line that frames one side of a chart
2. Datasheet � a table in which data is entered, usually resembling a spreadsheet
3. Data Label � text or numbers that describe the meaning of a particular data marker or series of data markers
4. Data Marker � usually, a value placed right over a data point that represents a single cell or data point
5. Data Series � the main categories of information in a chart
6. Data Table � a grid, either real or imaginary, that provides the exact data of a datasheet
7. Gridlines � lines, usually in increments of 10 or 2, that criss-cross to make the chart easier to read
8. Legend � a key that uses colors or patterns to discern between categories and data series
9. Trendline � a line that predicts future patterns or values based on available current data
Figure 6.6 provides a visual illustration of some chart terms:
|
Y-Axis (Value) |
|
X-Axis (Category) |
|
Series |
|
Gridline |
|
Plot Area |
|
Data Series |
|
Legend |
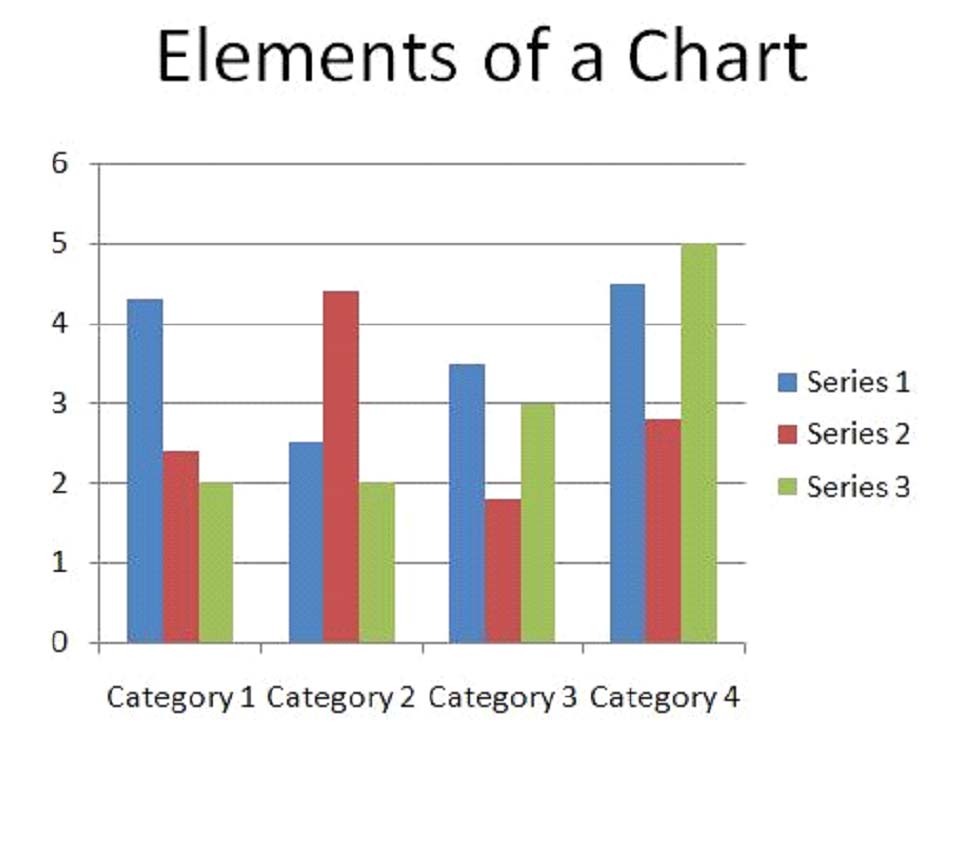
Figure 6.6 � Elements of a Chart
The easiest way to add a chart to your presentation is to add a slide that includes a chart automatically in its layout, such as the Chart and Contentlayout (see Figure 6.7). This layout provides six insert buttons in the body of the center text box:
1. Table
2. Chart
3. Smart Art
4. Picture
5. Clip Art
6. Media Clip
A chart can also be integrated into your presentation by using the Insert Chartcommand in the Illustrations group of the Insert tab (see Figure 6.8). Either way, you will be provided with many options for chart types in the Insert Chart dialog box (see Figure 6.9), and once you have made your selection, Microsoft Excel automatically opens for you to enter your data (see Figure 6.10).

Figure 6.7 � Insert Chart Button on Title and Content Slide
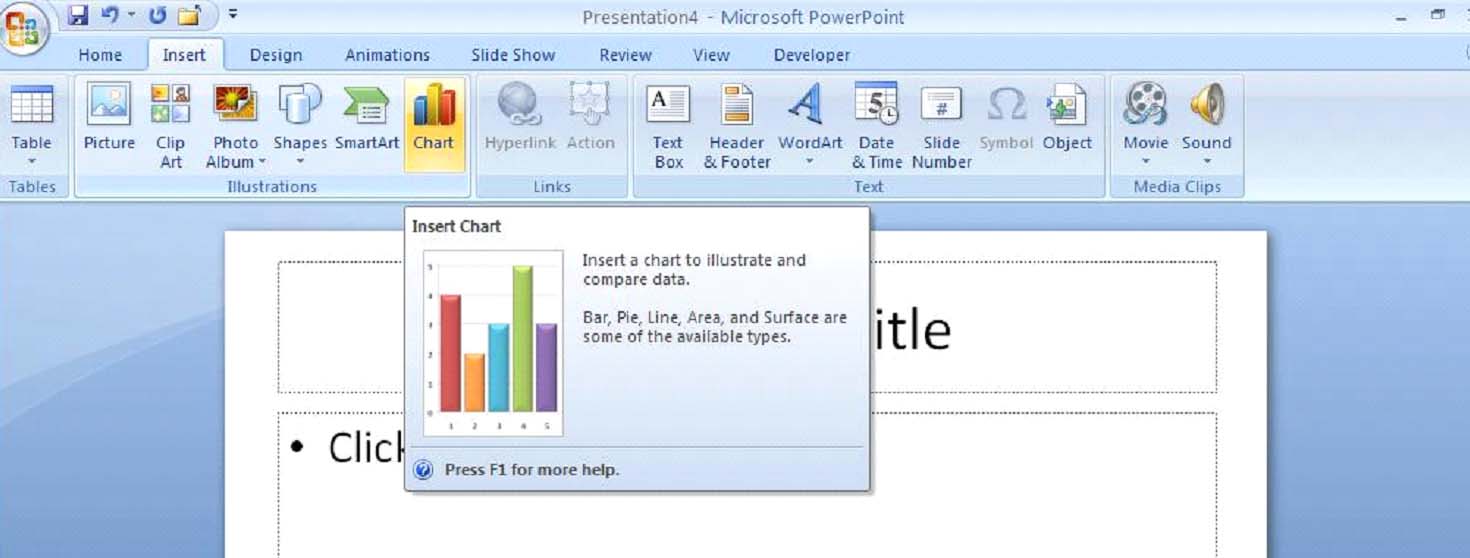
Figure 6.8 � Insert Chart Command
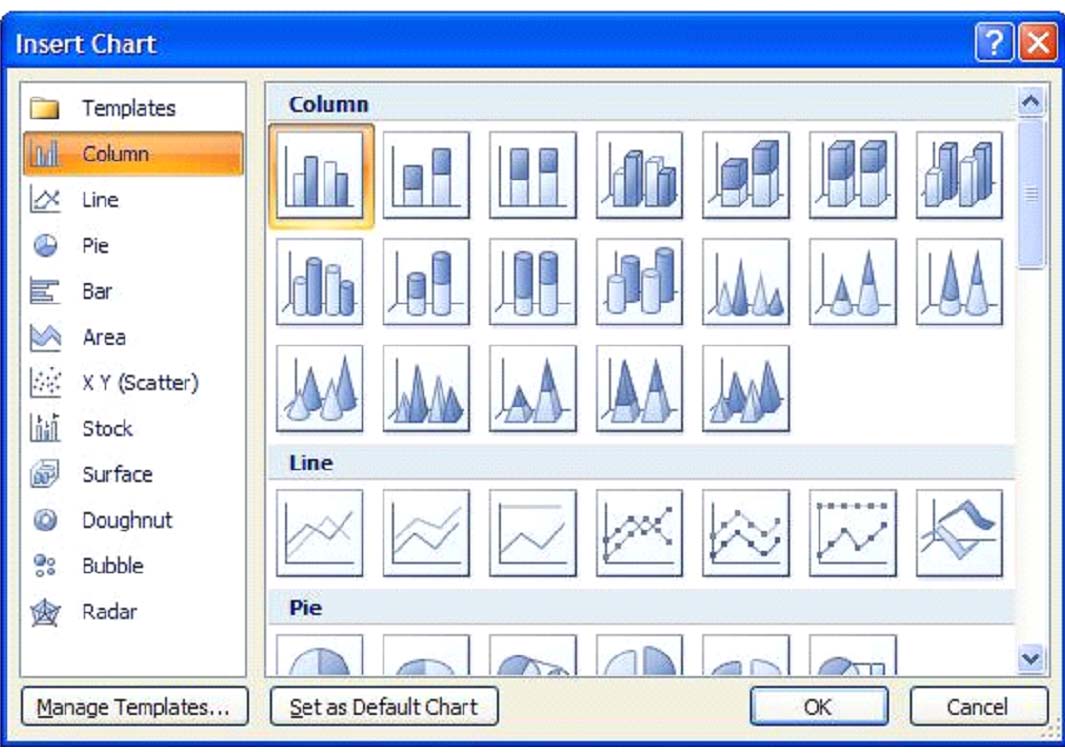
Figure 6.9 � Insert Chart Dialog Box
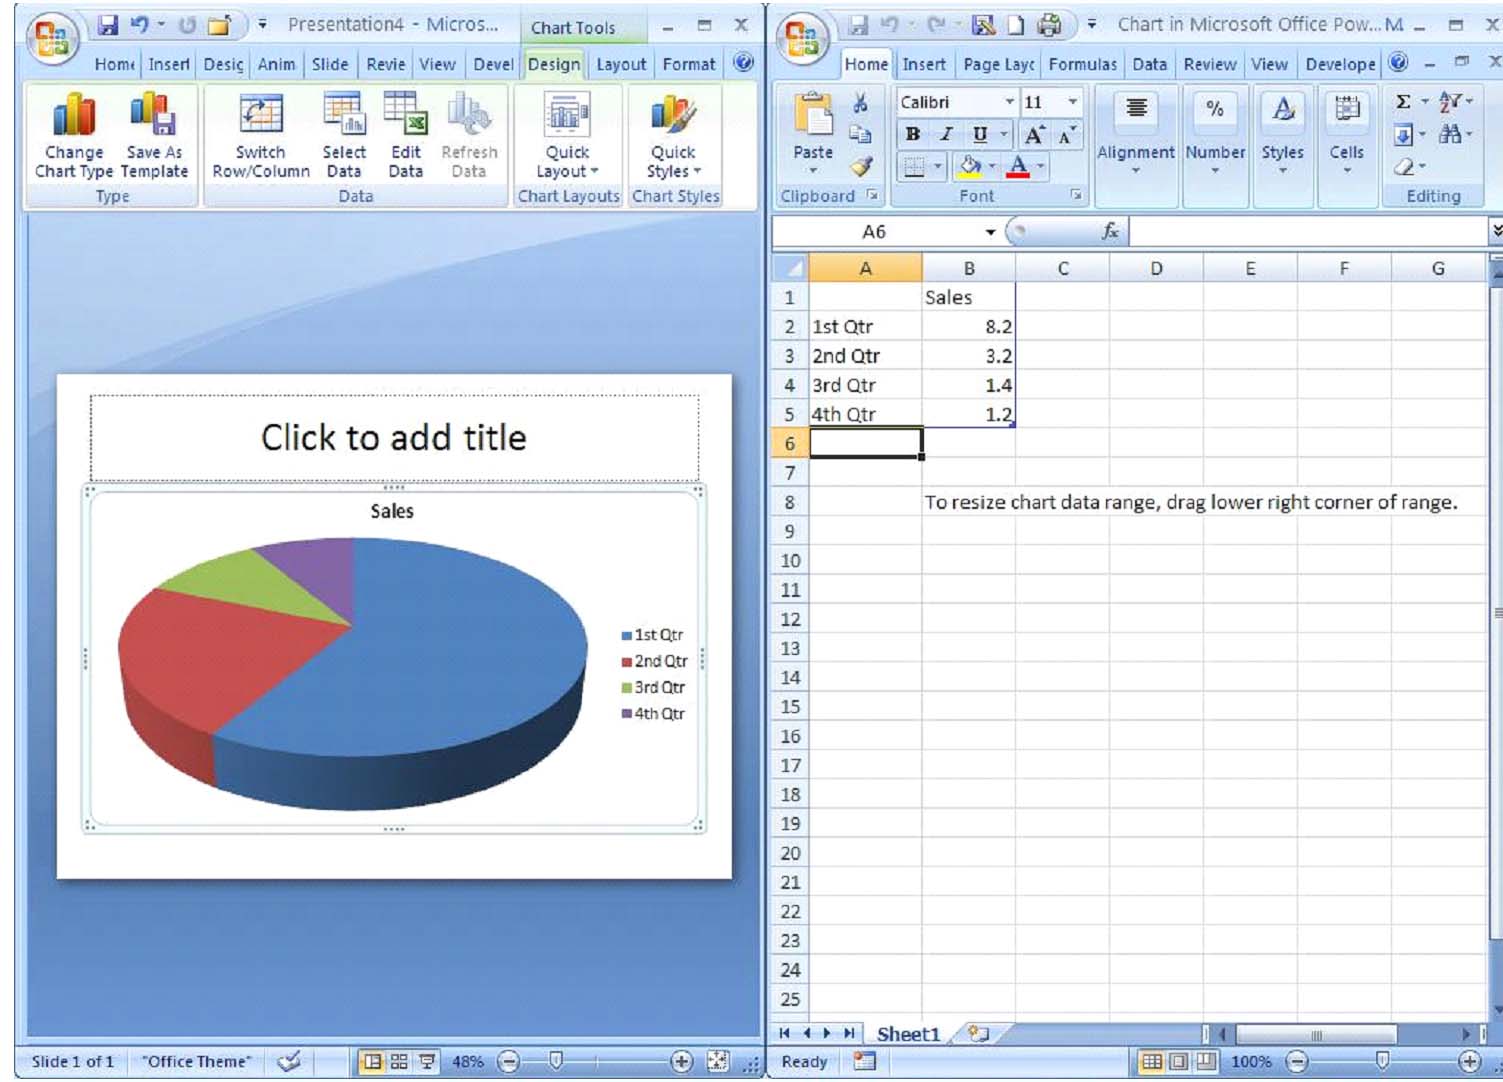
Figure 6.10 � Excel Opens with the Selection of a Chart
Using Data Sheets
We are assuming that Excel 2007 is installed on your computer as well as PowerPoint 2007. If this is not the case, you will be unable to use any of PowerPoint 2007's new charting features � that is, you will have to enter your data and calculate your numbers in the old way, by hand.
As a general rule, there will be sample data on the Excel spreadsheet. All you need to do is replace this data with your own. Usually, the first row and the first column will serve as headers for the data. In this case, the first row, "Sales," is the title of the chart and the information in the first column make up thecategories of the chart.
The data entered into Excel automatically links to the corresponding data field in PowerPoint, so it is only necessary to put information into Excel. Once your data has been entered, you may close Excel. Should you need to edit the data in the chart, you may reopen Excel by clicking on the chart and using the Edit Datacommand in the Data group of the Design for Chart Tools tab.
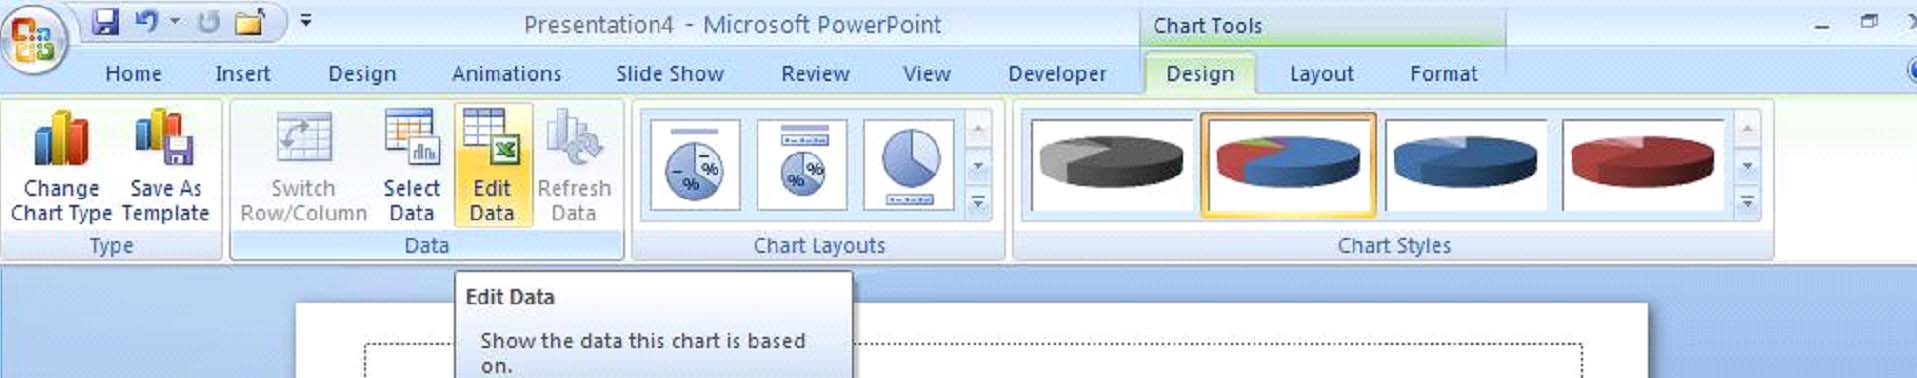
Figure 6.11 � Edit Data Command
Customized Charts
There are many options for customizing a chart in PowerPoint 2007. When a chart is active, meaning that it has been selected by clicking or double-clicking, three Chart Tools � Design, Layout and Format - tabs appear on the left of the Ribbon. Figure 6.12 shows the "Sales" chart customized.

Figure 6.12 � Sample Customized Chart