This article explores charts used during technical analysis. We discuss chart styles and the components within a price chart. Indicators and patterns are also covered.
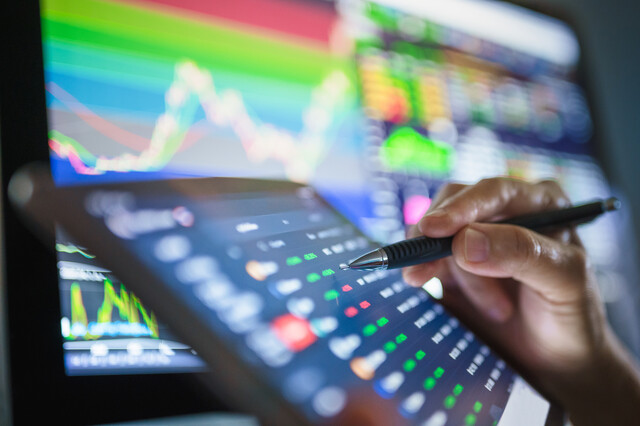
When technical analysis is used to make trading decisions, charts are the primary source of information. In today's marketplace most of the chart analysis is done through computer software that allows a trader to view data graphically (see figure 11-1). Charts vary in styles, but the primary data that is displayed are the most recent price quote, price range, historical pricing, date range, number of contracts traded.
There are three popular ways to display a contract's price range:
Line Chart � displayed as a line connecting price points between trading periods. The points can either be just closing prices or average prices throughout the trading period.
Bar Chart � displayed as a single, narrow vertical line, with the top point as the highest price for the period and the bottom as the lowest point. (Figure 11-1 is a daily bar chart, for example.) The opening price is shown as a small horizontal line that extends left and the closing price is a small horizontal bar extending right
Candlestick � displayed as a thick, vertical bar representing the gap between opening and closing prices; if the price range extends beyond that gap, then there can be an upper and/or lower shadow, which is a narrow vertical line that extends above or below the bar. If the closing price is higher than the opening price, the "stick" is one color (typically blue or black); if it is lower, then it is displayed as a different color (typically red).
Charts can be created to display various trading periods throughout a date range. The date range can expand from an intraday chart to the entire time the contract has traded. The date range can display price ranges by the day, week, month (usually 1-month, 3-month and 6-month periods), year and decade. The price range is the variation in price from beginning to end of the trading period. The price range will be displayed as a single unit on the chart for that period. For example, in a monthly chart the top and bottom of the price range represent the highest and lowest value for the month. Charts also typically display two other important sets of data: 1) the volume and 2) the open interest. Figure 11-2 shows where the volume and open interest are typically displayed.
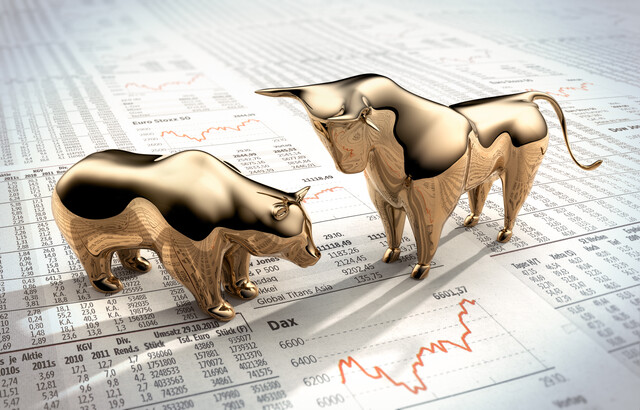
During chart analysis, the most significant detail to examine is the trend. A trend either continues or reverses at any given time. Prices are usually in an uptrend (bullish), downtrend (bearish) or sideways trend. A chart displays a trend through two parallel lines; the top line is extended from the highest peak and the bottom line is extended from the lowest trough and touches upon support and resistance points within the date range (see Figure 11-3).
When prices cross the trend lines, it can either mean a continuation or a reversal. When prices break through a resistance level, it can mean a breakout (bullish trend) is taking place. If trading takes prices below a support level, it is likely that a breakdown (bearish trend) is happening. A breakout during a bullish trend and a breakdown during a bearish trend are considered continuation patterns; on the flip side, a breakdown during a bullish trend or a breakthrough during a bearish trend is considered a reversal.
Many chart software packages provide the trader with the ability to detect signals about future pricing through the use of patterns and indicators. Chart patterns form pictures or lines that evolve through price movement; indicators are calculations which measure factors such as volatility, trends and momentum. Indicators can be either leading, which change prior to a trend, or lagging, which confirm a trend is in place. Software trading programs usually are equipped with several pattern and indicator tools that graphically represent price movement.
There is a wide variety of tools that traders can use when analyzing charts. The most popular include the following:
Leading Indicator
Oscillator � The oscillator is used during sideways-trending periods; traders use it to gauge overbought and oversold situations. It tests momentum by measuring the rate of change in prices over a period of time. At the bottom of the chart is a horizontal range bordered by two extremes through which a rising and falling line flows. When the line crosses the upper extreme, it indicates the contract is overbought; when it crosses the lower extreme, the contract is oversold. A 10-day oscillator will compare the most recent closing price to other closing prices within the 10-days period. If the recent price is higher, then a positive number is generated; if lower, then a negative number results. The result is then combined with the latest figure that has been plotted on the line. Oscillator examples include: the Relative Strength Index (RSI), which measures the magnitude and direction of recent price changes, and the Stochastics Oscillator, which calculates the direction of a potential new trend.
Lagging Indicator
Moving Average (MA) � The moving average is a trend-following indicator; the purpose of the MA is to track the progress of price changes. It represents an average of closing price data over a date range. Figure 11-4 shows a chart with two MAs. The most common moving average uses the last 10 days of closing prices. Each day, the most recent closing price (day 11) is added to the total and the oldest close (day 1) is subtracted. The new total is then divided by the total number of days (10) and the resulting average is plotted along a line that flows through the date range. The longer you extend the price data (e.g. 30 days), the smoother the MA appears. The smoother the MA is the easier it is to detect a pattern.
Moving average examples include: the Simple MA, which gives each closing price equal importance, and the Exponentially Smoothed MA, which assigns more "weight" to the most recent closing prices.
Indicators use crossovers, convergence and divergence to signal entry and exit signals. A crossover occurs when the indicator moves through an important level or average. A divergence occurs when the direction of the price trend moves opposite the direction of the indicator. Convergence occurs when two indicators move towards each other.
Pattern
Triangles - Triangles are patterns that exhibit a continuation pattern of price movement. They are viewed from left to right as two trend lines converge. They typically signal that a price movement is about to occur. There are three types of triangles:
Symmetrical � the convergence of a rising trend line that touches a series of sequentially higher troughs and a falling trend line that touches a series of sequentially lower peaks. When a price breaks out a sharp movement in that direction is usually expected.
Ascending � the price movement should continue in a bullish (upward) direction. Two trend lines form a horizontal upper side along a resistance level and an ascending lower side of the triangle along a series of rising troughs. Figure 11-5 shows this type of pattern.
Descending � the price movement should continue in a bearish (downward) direction. Two trend lines form a descending upper side along a series of falling peaks and a horizontal lower side along a support level.
Chart analysis is considered critical to successful trading. However, the signals, indicators, patterns and other rule-defined measurements are not a guarantee that prices will move in the direction you expect. Often signals must be supported by other data, including a rise in volume in some cases. Experts caution new traders to learn as much as possible about technical analysis before using the information to make trading decisions. Professional traders have developed systems which trigger automatic buy or sell actions.
Careers in Futures Trading
Within the futures trading industry, there are two options in becoming a trader: trading on your own behalf or on behalf of another party. Traders who manage their own accounts are called self-directed traders. As a self-directed trader, you are free to trade as you see fit (within the rules of the exchange and the Commodity Futures Trading Commission). You are not required to join an association or exchange, but in order to place trades you must open an account through a Futures Commission Merchant (e.g. brokerage house). There are no educational or experience requirements to fulfill when becoming a self-directed trader.
The other option is to pursue a career that provides trading activities on behalf of clients. In order to qualify for this type of work, a college degree in finance is required and, for most high-level occupations, registration with the National Futures Association is necessary. This career path typically involves working for a futures commission merchant, though licensed individuals are not required to be employed by an FCM. Often a trader starts as an Associated Person for the brokerage house. Another opportunity is to become an Introducing Broker that has one of two relationship styles with the FCM:
� Guaranteed IB � The FCM will guarantee or vouch for the activities of the IB. The FCM manages the client's funds and trading functions; in exchange for the guarantee, the IB must maintain an exclusive relationship with the FCM. By guaranteeing the IB, the FCM is not guaranteeing results but endorsing the IB's character and trading abilities.
� Independent IB � The IB can maintain relationships with multiple FCMs; however, he must maintain capital requirements with each FCM (in some cases over $25,000) for the privilege of being independent. The independent IB can negotiate with various FCMs for the best commission rate when placing trades
The AP can choose to become a Branch Manager for an FCM. By passing additional testing, a BM can oversee other APs and manage the day-to-day operations of the brokerage house branch. For a trader seeking to gain a percentage of the profits made on behalf of their clients, the position of Commodity Trading Advisor allows him to manage a client's account. Under a managed account, the CTA has explicit authority to make trades in exchange for a proportionally smallmanagement fee (usually one to five percent of assets being managed) and an incentive fee based upon the profits he attains. The incentive fee can range from 15% to 40% of the profits per year. The CTA position requires you to pass additional tests and usually requires several years of trading experience.
A CTA must maintain segregated accounts, meaning she must not combine funds from more than one account and must place orders independently for each account. This level of activity is paid for through the management fee. Another similar position is the Commodity Pool Operator, which requires the same educational and experience standards and has the same payment structure as the CTA. The difference is that the CPO is not required to maintain segregated accounts; he combines funds from numerous account holders, places aggregate trades and allocates returns based upon a formula that computes the percentage ownership each account holder has in the pool.
| Licensing &Testing Requirements |
Traders acting as intermediaries must pass a series of tests as they progress through a career in futures markets. All financial testing is administered by the Financial Industry Regulatory Authority (FINRA). The National Commodity Futures Examination � called the Series 3 Exam � is required in order to become licensed as an AP or IB. Both the CFTC and NFA require successful completion in order to trade as a broker. The 120-question test covers two knowledge areas: market knowledge and regulatory knowledge. In order to become a BM, you must pass the Branch Manager Exam, otherwise known as the Series 30 test, which has 50 questions covering rules, regulations and responsibilities of futures financial management. The CTA and CPO positions require successful completion of the Futures Managed Funds Exam (Series 31), which has 45 question pertaining to regulations, promotional materials, disclosures and upfront fees. In order to qualify for the Series 30 and 31 exams, a trader must pass the General Securities Representative Exam, otherwise known as the Series 7 Exam. This 260-question test covers the following:
� Customer evaluation
� Providing investment information
� Handling customer accounts and placing orders
� Understanding and explaining the securities' market organizations and participants
� Monitoring economic and financial events and portfolio analysis