Unlock the full power of Excel and transform your data skills with the Advanced Excel 2019 course, where cutting-edge features meet practical applications. This isn't just a class; it's a breakthrough in how you handle complex data, empowering you to become a data-driven decision-maker. Dive into a world where creating dynamic reports, visualizations, and analyses is not just possible, but easy and efficient. Whether you're aiming to boost your career prospects or streamline your business operations, this course is your gateway to mastering Excel's most advanced capabilities, ensuring your efforts translate into meaningful, actionable insights. Join us now and start your journey to data mastery, confident that with each lesson, you are gaining an indispensable toolkit for success.
Lesson 1. Custom Views, Outlines, and Templates in Excel
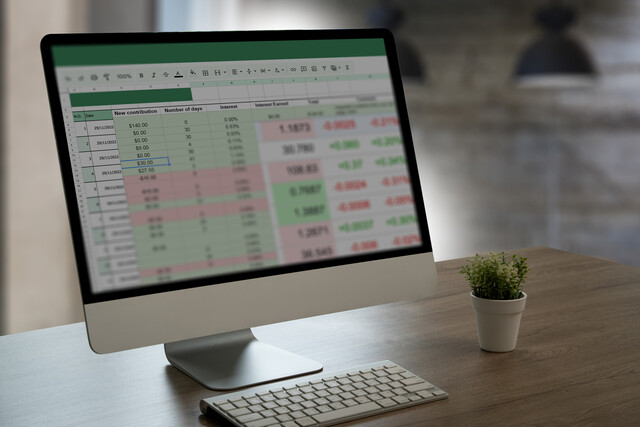
To streamline spreadsheet management, Excel offers templates and outlines to simplify data presentation, making it easier to share and emphasize important sections. Custom views can be created to easily hide unnecessary data ranges, improving focus while working.
Lesson 1-
Lesson 1 Exam+
Lesson 1 Exam
Motives for Taking this Course+
Motives for Taking this Course
Lesson 2. Math Functions: Simplifying Excel Calculations
Excel's functions such as ROUND and SUMIF elevate data processing by providing specialized calculations that cater to specific scenarios like rounding to desired precision and conditional summing. Mastering these functions transforms you into a proficient data analyst, making Excel an invaluable tool.
Lesson 2-
Lesson 2 Exam+
Lesson 2 Exam
Lesson 2 Activity+
Lesson 2 Activity
Lesson 3. Error Types Unveiled: Excel's Toolset for Troubleshooting
Use Excel's ISNUMBER to differentiate numbers from text, allowing for dynamic calculations based on cell content. For distinguishing text, ISTEXT and ISNONTEXT offer simple solutions for checking if cells contain text or non-textual data.
Lesson 3-
Lesson 3 Exam+
Lesson 3 Exam
Lesson 4. Excel Data Lookups Made Simple
VLOOKUP is ideal when you need to find specific data in a vertical column by referencing adjacent cells. It's particularly useful for dynamic results that auto-update when datasets change.
Lesson 4-
Lesson 4 Exam+
Lesson 4 Exam
Lesson 5. IF Function Unpacked: Building Powerful Excel Formulas with Conditions
Lesson Summary 1: The IF function in Excel evaluates conditions and displays results based on whether they are true or false, allowing for complex calculations with nested statements and logical operators. Common issues include logical errors and adjusting conditions for greater accuracy, such as using 'greater than or equal to' rather than 'greater than' alone to prevent bugs.
Lesson 5-
Lesson 5 Exam+
Lesson 5 Exam
Lesson 6. Exploring Excel's Text Functions: A Comprehensive Guide
Excel text functions are integral for efficient data formatting, including FIND and SUBSTITUTE for text searches and replacements and LEFT, RIGHT, and MID for substring extractions. UPPER, LOWER, and PROPER functions standardize text case, enhancing readability and consistency across spreadsheets.
Lesson 6-
Lesson 6 Exam+
Lesson 6 Exam
Lesson 7. Color-Coding with Logic in Excel
By leveraging conditional formatting, Excel users can personalize cell styling based on predefined data conditions, such as numeric comparisons or text occurrences. This enables efficient data analysis and visually appealing spreadsheets without manual formatting.
Lesson 7-
Lesson 7 Exam+
Lesson 7 Exam
Lesson 8. From Rows to Visuals: A Journey with Sparklines
Sparklines in Excel enhance data visualization by embedding small, dynamic graphs within individual cells to show trends quickly. Whether using line, column, or win-loss types, they adapt effortlessly to data updates, offering an efficient means of presentation.
Lesson 8-
Lesson 8 Exam+
Lesson 8 Exam
Lesson 8 Activity+
Lesson 8 Activity
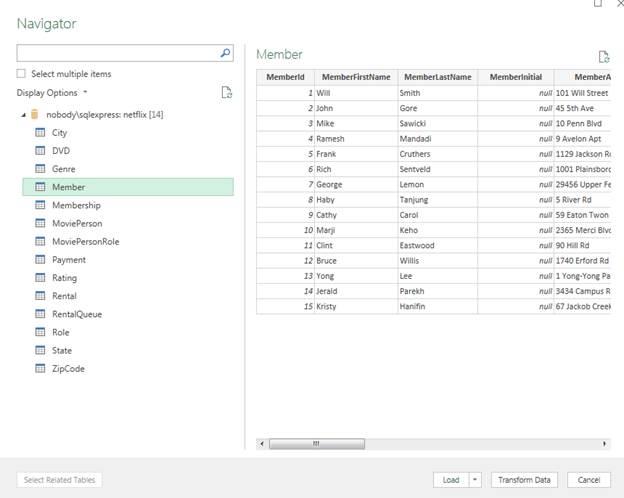
Lesson 9. Linking to External Excel Workbooks
Excel's 'Get and Transform' feature supports retrieving data from various sources, enabling users to easily integrate and analyze data across distinct worksheets and workbooks.
Lesson 9-
Lesson 9 Exam+
Lesson 9 Exam
Lesson 10. Beyond the Workbook: Exploring Importing Techniques for Various Data Sources
Importing data into Excel from various sources, including SQL databases and web pages, is streamlined through the 'Get & Transform' feature, which supports diverse data formats. While SQL databases offer easily integrated structured data, web page data likely requires meticulous cleaning and formatting to fit analytical needs.
Lesson 10-
Lesson 10 Exam+
Lesson 10 Exam
Lesson 10 Activity+
Lesson 10 Activity
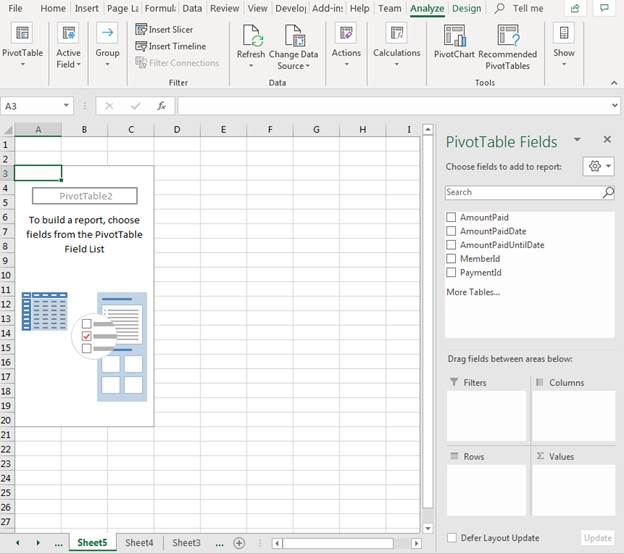
Lesson 11. Exploring the Dynamic World of Pivot Tables in Excel
Excel's pivot tables represent a shift in data analysis, providing a user-friendly method for restructuring and summarizing data from multiple sources. By accommodating various aggregation and grouping settings, pivot tables empower users to gain insights efficiently without manual data manipulation.
Lesson 11-
Lesson 11 Exam+
Lesson 11 Exam
Lesson 11 Activity+
Lesson 11 Activity
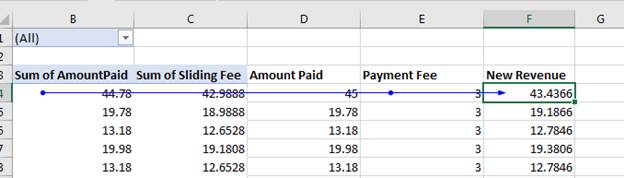
Lesson 12. Innovative Uses of Pivot Tables for Data Analysis
Transform large data sets into comprehensive reports by leveraging pivot table capabilities, including advanced calculated fields and Excel functions. Simplify your filtering tasks with slicers and timelines, while keeping your data up-to-date through easy refresh options.
Lesson 12-
Lesson 12 Exam+
Lesson 12 Exam
Lesson 13. Creating a Pivot Chart
Excel's pivot charts transform data into a visually engaging format, making complex datasets more accessible to third-party viewers. Through customizable elements and filters, these charts enhance data clarity and decision-making processes.
Lesson 13-
Lesson 13 Exam+
Lesson 13 Exam
Lesson 13 Activity+
Lesson 13 Activity
Lesson 14. Goal Seek and Scenarios: Unveiling Future Revenue Insights
By leveraging Excel's What-If analysis tools, businesses can foresee the effects of proposed variable adjustments, allowing them to predict outcomes and refine strategies proactively. Tools like Goal Seek offer targeted analyses, while Scenario Manager provides comprehensive exploration of multiple potential adjustments, aiding effective decision-making.
Lesson 14-
Lesson 14 Exam+
Lesson 14 Exam
Lesson 15. Advanced Problem Solving: From Goal Seek to Solver
Excel's Goal Seek enables basic What-If analysis by adjusting one variable at a time, but complex scenarios benefit from Solver for managing multiple unknowns and constraints. Available via add-in, Solver offers advanced algorithms for optimization, equipped to handle large data sets and multiple decision parameters.
Lesson 15-
Lesson 15 Exam+
Lesson 15 Exam
Lesson 15 Activity+
Lesson 15 Activity
Lesson 16. Excel Analysis Toolpak: Intro
The Analysis ToolPak enhances Excel's capabilities by allowing complex statistical evaluations, offering tools for users to perform tests like t-tests and ANOVA without needing to write intricate formulas. It serves non-statisticians and statisticians alike, simplifying data processing and making advanced statistical features accessible within the Excel interface.
Lesson 16-
Lesson 16 Exam+
Lesson 16 Exam
Lesson 17. Data Validation 101
Data validation in Excel helps manage the type of data that third parties enter into spreadsheets, avoiding potential formatting issues. This ensures data integrity by restricting entries to specific types such as numbers or dates and providing feedback or warnings as needed.
Lesson 17-
Lesson 17 Exam+
Lesson 17 Exam
Lesson 18. Unleashing Data Potential: Mastering Get & Transform Queries
By utilizing 'Get & Transform,' users can import, query, and segment large datasets from databases with Excel, offering a robust framework to perform advanced data manipulation. Power Query streamlines data editing, allowing for the creation of targeted reports and insights from meticulous data extraction.
Lesson 18-
Lesson 18 Exam+
Lesson 18 Exam
Lesson 19. Exploring Excel's Formula Tools for Error-Free Sheets
Excel 2019 offers comprehensive tools for formula auditing, essential for ensuring data integrity and avoiding unintended changes. Key features like the 'Show Formulas' function allow users to identify and address formula-related issues efficiently.
Lesson 19-
Lesson 19 Exam+
Lesson 19 Exam
Lesson 20. Automating Excel with Macros and VBA: A Comprehensive Guide
Excel 2019 offers the ability to record and run macros for automating repetitive tasks, saving time during spreadsheet formatting or data management. More advanced users can delve into Microsoft's Visual Basic for Applications to create complex macros, enabling enhanced automation through custom programming.
Lesson 20-
Lesson 20 Exam+
Lesson 20 Exam
The Final Exam+
The Final Exam
In This Course
16 Hours average completion time
1.6 CEUs
20 Lessons
28 Exams & Assignments
208 Discussions
20 Videos
21 Reference Files
Mobile Friendly
Last Updated July 2023
Description
Excel is one of the most powerful tools in Microsoft Office. You can import, query, analyze and manipulate data to create powerful reports that can be used by individuals and enterprise businesses alike. This course explores some of the more advanced features of Microsoft Excel to give you a more powerful experience when you need the most out of spreadsheet software.
In this Excel 2019 advanced course, you'll learn all about...
Outlines, Custom Views, and Templates
Mathematical Functions
Data Functions and Data Lookups
The IF Function
Manipulating Text
Conditional Formatting
Sparklines
Importing, Cleaning and Validating Data
Pivot Tables and Pivot Charts
The What-If Analysis
Goal Seek and Solver
The Analysis ToolPak
Using Get & Transform to Perform Queries
Macros
And Much More!
The course starts with functions and data lookups, as these components of Excel help the spreadsheet creator with advanced calculations and import functionality. We then cover conditional formatting for highlighting important cells based off of conditions. Sparklines are also covered so that the learner can get a quick data visualization of the information stored in each worksheet.
Pivot tables are one of the most beneficial tools in Excel, and this course covers pivot tables both basic and advanced features. It then moves on to pivot charts, which are graphs that can be used with pivot table data.
Analysis tools in Excel 2019 are some of the most advanced and useful to users that want to run complex reports. Excel has three What-If analysis tools that can be run on your data and provide reports on goals that give answers to your problems. The Solver and Analysis Toolpak are two add-ins that expand on these tools, and they are also covered in this course.
The final lessons cover data validation, troubleshooting, querying data and macros. These lessons provide ways to work with data and clean up unstructured information. This course fully covers advanced features in Excel so that you can create complex spreadsheets for business or individual use.
Skills You'll Develop
Data Validation for Quality Control
Custom Views for Enhanced Data Presentation
Macro Automation for Streamlined Tasks
Sparklines for Quick Data Visualization
Comprehensive Pivot Table Mastery
Conditional Formatting for Data Highlighting
Data Lookup and Analysis Skills
Advanced Data Import and Query Techniques
Effective Use of Goal Seek and Solver
Mastering Advanced Mathematical Functions
Statistical Analysis with Analysis ToolPak
More About This Course
Leverage Pivot Tables: Summarize data for meaningful insights.
Create Dynamic Charts: Transform data into engaging visuals effortlessly.
Blend Scents with Purpose: Learn to elevate fragrance creations.
Develop Advanced Problem Solving: Optimize outcomes using Solver tool.
Harness IF Function: Craft logical formulas for detailed reports.
Enhance Productivity with Macros: Automate tasks with efficiency.
Streamline Data Validation: Ensure entry accuracy and consistency.
Use Conditional Formatting: Highlight key data with visual cues.
i found this course to be very thorough in explanation. The detail and explanation was very easy to follow and look back at.
PM
"Extraordinarily Helpful"
★★★★★
Some parts were easier than others but I was able to learn many new things in Excel that I was not aware of previously. I look forward to using these in my job.
DG
"Extraordinarily Helpful"
★★★★★
This course was well put together and helped me grasp all concepts offered.
SB
"Extraordinarily Helpful"
★★★★★
Thank you for going the extra mile. Loved the course!
Our site uses cookies for general statistics, security, customization, and to assist in marketing efforts in accordance with our
cookie and privacy policy.