Special data fields are found in the Field Explorer panel. Special data fields are pre-built fields with values in them. We're going to explore the various special data fields in this article.
Date and Time Fields
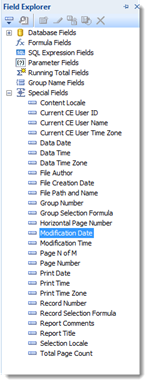
To locate the special data fields in Crystal Reports, go to the Field Explorer panel.
Click the plus sign (+) beside Special Fields.
![]()
Let's take a look at some of these fields.
-
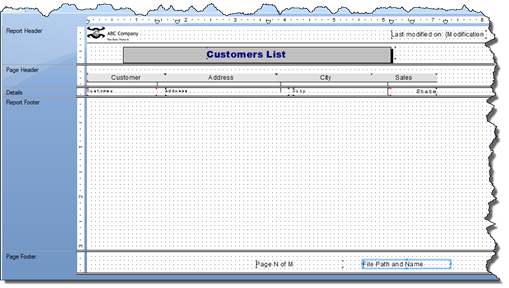
The Data Date field and the Data Time field show the last time the data in a report was updated. It bases the date and time by the date and time showing in the Status Bar when you update data.
-
Print Date and Print Time show the date you previewed the report.
-
Modification Date and Modification Time refer to the date and time the structure of the report was modified.
To use these special data fields in a report, select the field you want to use, then drag it to where you want it to appear on the report.
Using a Special Data Field to Add Page Numbers
You can also use a special data field to add page numbers to your report. There are three special fields in Field Explorer that you can use for adding page numbers in your report.
These three fields are:
1. Page N of M.
2. Page Number
3. Total Page Count
You can add page numbers wherever you want, but they are usually found in the Page Header or Page Footer.
Let's add the Page Number special field to our report. We are going to do this in Design view, although we could also do it in Preview.
To start, select the Page Number special field in Field Explorer.
Drag it to where you want to place it in your report. We are going to place it in the Page Footer.
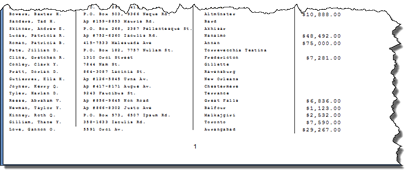
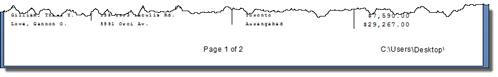
If we go to Preview and scroll to the bottom of our report, we will see we are viewing page 1.
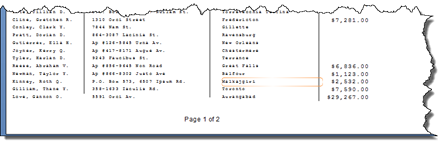
If we have a lot of pages in our report, we may not want to simply add page numbers. We may also want to let someone know exactly how far they are into the report. For example, page 101 of 250 pages. We can do this in Crystal Reports by using the Page N of M special field.
Add the Page N of M special field to your report the same way that you added the Page Number field.
You can see it displayed in our report below.
In addition, you can also add the total page count using the Total Page Count field in Field Explorer.
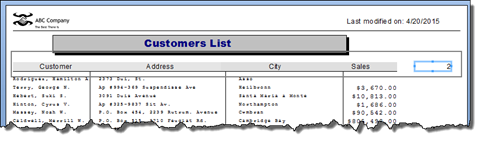
We have added it to our Page Header. As you can see, it displays the total number of pages in a report.
Adding a File Path
Once you create a report, you may print out copies to distribute to coworkers, employees, shareholders, et cetera. Although a printed copy is a nice thing to have, it's also helpful to let people know where they can view the original report. To accomplish this, you can add a file path to the Page Footer of your report using the special field entitled File Path and Name.
To use the File Path and Name field, drag it to your Page Footer. We are going to use Design view so we can place it correctly.
Go to Preview. You will see the file path that leads to the report.
Other Special Fields
In addition to the special fields we've already covered, there are some other special fields that are common in Page Headers and Page Footers.
These are:
File Author � or the person who created the report.
File Creation Date � or the date the report is created.
Report Title � or the title of the report.
Report Comments � any comments added to the report.
With the exception of File Creation Date, all these fields will be empty when you place them on your report. To add the information that will be supplied to the fields, go to File>Summary Info.
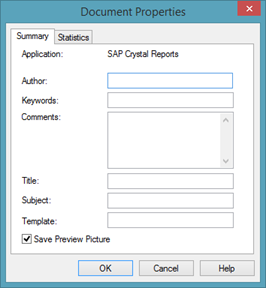
In the Document Properties dialogue box, you can enter the author, comments, and title.
Click OK when you are finished.
Listed below are some additional special fields found in Field Explorer. You may not ever use some of them; however, it's helpful to know what they are.
-
Record Number will place the current record that you're on. It's helpful in the Details section.
-
Current CE (Crystal Enterprise) fields. These are helpful if you have the enterprise server installed and want to see the user name, ID, or time zone of the person logged in.
-
Horizontal Page Number if your page is extremely wide.
-
Group Number and Group Selection Formula
-
Record Selection
-
Contact Locale will show the regional settings for your computer, such as US English.
Non-Data Objects
Adding Text Objects
A text object is a non-data object. It's simply a textbox that you can draw anywhere on your report in which you can then add text. The text that you type into a text object does not come from a database, meaning you can add anything you want. Perhaps you'll use a text object in the Report Header or the Report Footer. Maybe you'll even want to add a text object to the Details section.
To add a text object, go to the Insert toolbar and click the Insert Text Object button.

You can add a text object to your report in either Preview or Design view. We are going to use Design.
Once you click the Insert Text Object button, you mouse cursor will turn into a large plus sign as you hover it over your report.
Move your mouse to where you want to place the textbox, then draw it onto the report. As you can see below, the textbox appears as a rectangle with a blue border.
Double click on the textbox to add text.
Click outside of the textbox when you're finished.
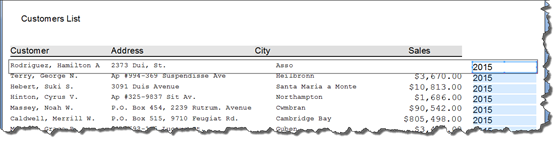
NOTE: Keep in mind that if you add a text object to the Details Section, it will appear in every single Details section of your report. In the snapshot below, we added a textbox, then put in 2015. As you can see, it appears next to every row in our report.
Creating a Line
A line is also another non-data object that you can add to your reports. The line can either be horizontal or vertical. It can be used to divide sections or to help make the report easier to read.
To insert a line, go to the Insert toolbar and click the Insert Line tool.

You can use either Preview or Design view when inserting a line into your report.
Once you click on the Insert Line tool, your mouse cursor will turn to a pencil.
To draw a horizontal line, click and drag across your report. You don't have to worry about the line being straight. It will automatically be straight as you draw it. It's very easy to use.
Your horizontal line can extend completely across a section � or only partially. The choice is up to you. Just keep in mind that if you add a horizontal line to one Details section, it will appear in all of them.
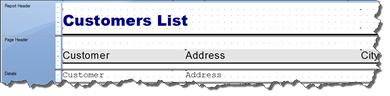
We added a horizontal line to the Report Header section.
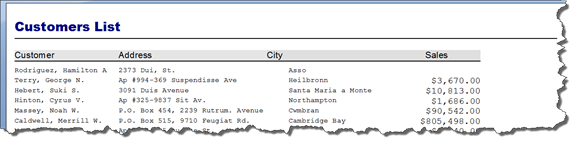
Here it is in Preview:
You can also see it in Design view.
In addition to a horizontal line, you can also add a vertical line. A vertical line can span across multiple sections. For example, you can add one vertical line to the Page Header, Details, and Page footer section.
Use the Insert Line tool to add a vertical line, then draw it onto your report in either Preview or Design view.
Below, we've added several vertical lines to the Details section.
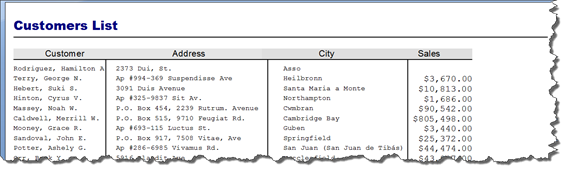
Remember, you only have to add a vertical line to one Details section. It's then added to every Details section � or every row of data.
Formatting Lines
In the last section, we added a horizontal line and several vertical lines to our report. These lines were simple black lines. However, if we want, we can also format the lines by changing the line style, thickness, and color.
To format a vertical or horizontal line that you've added to a report, select the line, then go to Format>Format Line.
You will then see the Format Editor dialogue box.
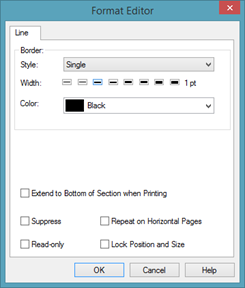
In the Border section, click the Style dropdown menu to select a new line style.
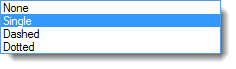
You can choose a single line (which we already have), a dashed line, or a dotted line.
Next, choose a width for the line.
In the Color dropdown menu, choose a color for the line.
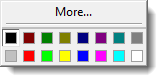
If you click More, you will be taken to the Color Picker where you can create a custom color.
Once you've selected the type, width, and color of the line, the Format Editor dialogue box gives you a few more options.
You can:
-
Extend to the bottom of section when printing.
-
Suppress. Hides it from Preview, but it still shows in Design view.
-
Repeat on Horizontal Pages if the report runs on horizontal pages.
-
Read-Only. This will grey out the line formatting options so the line cannot be accidentally re-formatted.
-
Lock position and size. Prevents moving or resizing the line.
Click OK when you are finished.
Adding a Box
You can add boxes to your report to further "dress up" the design. You can insert a textbox on a box, but the main purpose of a box is to lend to the design.
As with the textbox and line, you can add a box to your report while in Preview or Design view. The choice is yours.
To add the box, click the Insert Box tool on the Insert toolbar.
Your mouse cursor will then turn into a pencil.
You can then draw the box on the report.
The box will appear on your report as a white box with a black border, as shown below in Design view.

To format the box, click to select the box, then go to Format>Format Box.
You will then see the Format Editor dialogue box.
There are two tabs in the Format Editor: Box and Rounding.
Under the Box tab.
1. In the Border section of the dialogue box, you can choose the style, width, and color of the box's border.
2. If you want to add a drop shadow to the box, put a checkmark in the box.
3. Next, you can choose the fill color for the box in the Fill section.
4. You can also choose whether to close the border.
5. The rest of the options in the box Format Editor are the same as you saw when you inserted a line into your report.
Next, click on the Rounding tab in the Format Editor.
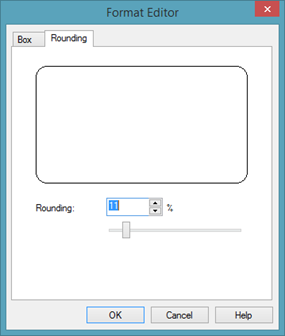
By adding a percentage or using the slider, you can round the corners of your box. The box that appears in the dialogue box gives you a preview of how the corners of your box will look when you're finished.
Click OK when you're finished.
Our box is pictured below in Preview. Notice that we've moved our textbox to its centered on our box.
You can also draw a box that spans across multiple sections.
Let's say we want to create a box that starts in our Page Header section and goes through all of our Details sections.
The easiest way to do this is in Design view.
Select the Insert Box tool.
Draw the box in the Page Header and Details sections, as we've done below.
With the box selected, go to Format>Format Box.
Format the box as you learned to do earlier in this section.
Adding an Image
To insert images or a company logo into your report, go to the Insert toolbar, and click the Insert Picture tool.

When you click the Insert Picture tool, you will see the Open dialogue box.
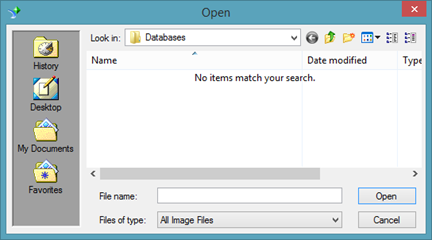
Locate the image on your computer, then click Open.
You will see an outline of your image attached to your mouse cursor as you move it across the report.
Click to place the image. You can do this in Preview or Design view.
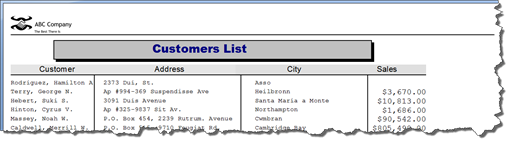
As you can see, our image is the Report Header section. It appears on top of the horizontal line and our box.
If we wanted the image to appear behind our box, we would click the image to select it, right click, then go to Move>Backward to move it so it appears behind the box.
If we wanted the image to appear behind everything, we would right click, then go to Move>To Back.
We can resize the image by selecting it, hovering our mouse over the handles until the two-way arrow appears, then dragging inward or outward on the handles.
We can move the image by selecting it, hovering our mouse over it until the four-way arrow appears, then dragging and dropping it to its new location.
To resize or move the image, we can also select the image, then go to Format>Format Graphic. Click on the Picture tab.
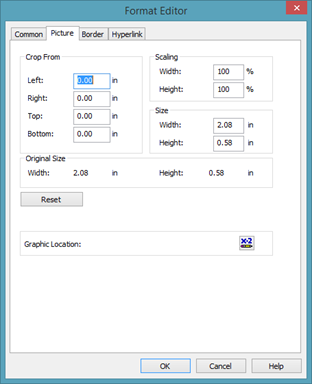
In the Format Editor dialogue box, you can crop the image by specifying how many inches you want to crop away from the sides, top, and bottom. Keep in mind this is in inches, not in pixels.
You can also scale the image. To keep the image's proportions, enter the same percentages for width and height.
If you want to change the size of the image, you can do so by changing the measurements. However, to keep the image's proportions, make sure you add or subtract the same number of images to height as you do to width.
Click OK when you're finished.
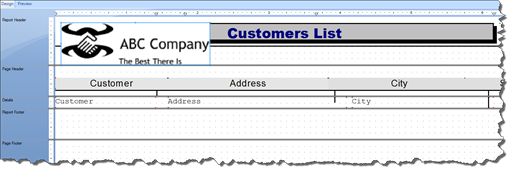
We scaled our image to 50% of the width and height so it kept its proportions. We also moved our box and text object to the Page Header section.
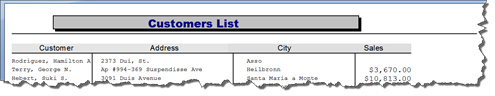
You can see our report below.
Adding a Data Field to a Text Box
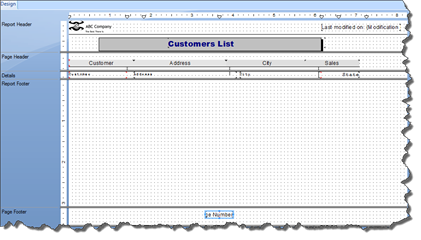
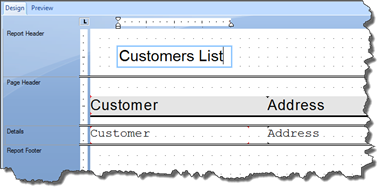
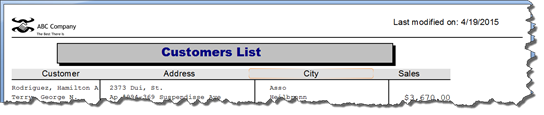
Let's say we want to add a data field to a text box. You can add any data field from the Field Explorer. However, for this example, we want to add the date that the report was last modified to the Report Header.
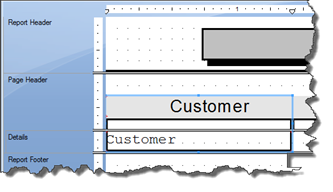
To do this, we first draw a text box and add any text, as pictured below. You can see our text box on the right side of the Report Header.
Next, we are going to go to the Field Explorer panel.
Click the plus (+) sign to expand the Special Fields section.
We are going to choose Modification Date, as highlighted in blue below.
Drag the field to the textbox.
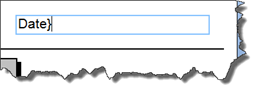
Click outside of the textbox to see the results.
Removing a Non-Data Object
Textboxes, lines, boxes, images, and charts are all non-data objects.
To remove a non-data object from your report, select the non-data object, then right click.